OPEN-SOURCE SCRIPT
HTF 6H Visualiser for 30M - ADK - W
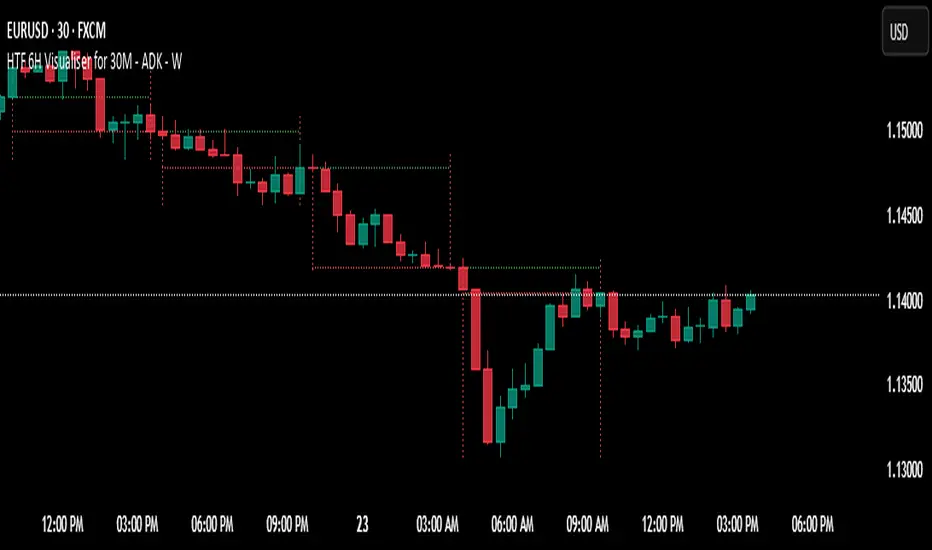
HTF 6H Visualiser — use on 30-minute charts
Purpose – lets 30-minute traders see the prior 6-hour candle’s range, open and close without changing time-frames.
Visual elements
Two dotted vertical lines mark the 6-hour candle’s start and an “early” finish one 30-min bar before the true close (avoids overlap).
Vertical colour: green for bullish 6 H close, red for bearish.
Dotted green horizontal at the 6 H open, red horizontal at the 6 H close – both drawn only between the two verticals.
Verticals are clipped to that candle’s exact high and low.
Data window – auto-deletes oldest guides so only ~2 trading days (8 candles) remain on the chart.
Typical uses – mean-reversion to 6 H opens/closes, quick HTF bias check, liquidity-grab targets.
Skrip sumber terbuka
Dalam semangat TradingView sebenar, pencipta skrip ini telah menjadikannya sumber terbuka, jadi pedagang boleh menilai dan mengesahkan kefungsiannya. Terima kasih kepada penulis! Walaupuan anda boleh menggunakan secara percuma, ingat bahawa penerbitan semula kod ini tertakluk kepada Peraturan Dalaman.
Penafian
Maklumat dan penerbitan adalah tidak bertujuan, dan tidak membentuk, nasihat atau cadangan kewangan, pelaburan, dagangan atau jenis lain yang diberikan atau disahkan oleh TradingView. Baca lebih dalam Terma Penggunaan.