OPEN-SOURCE SCRIPT
Telah dikemas kini Price × Volume Table
It creates a table showing:
1- Daily Close × Daily Volume
2- Current Close × Current Volume
3- Close × Highest Volume (last 360 candles)
1- Daily Close × Daily Volume
2- Current Close × Current Volume
3- Close × Highest Volume (last 360 candles)
Nota Keluaran
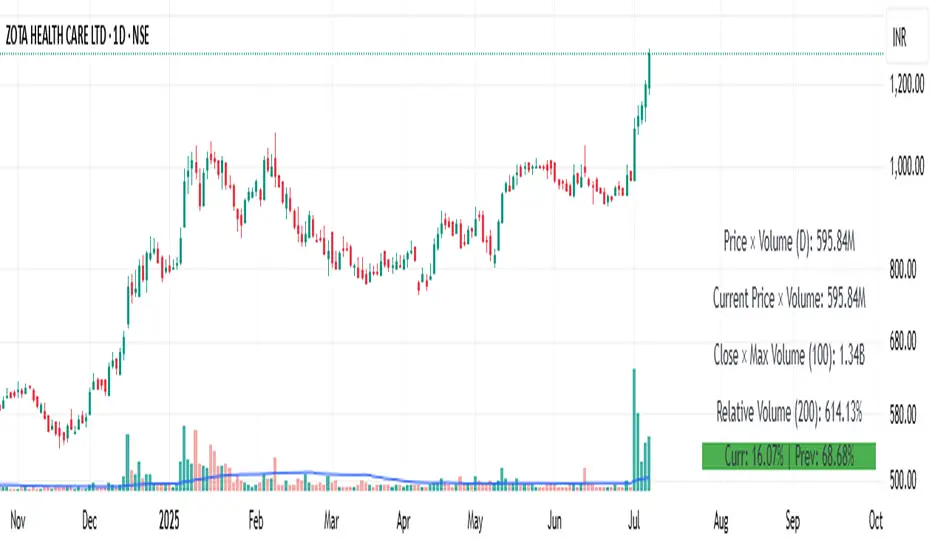
This indicator displays a real-time table showing important volume and liquidity metrics to help traders assess market activity at a glance.Included Metrics:
Price × Volume (1D): Daily closing price × volume from the selected higher timeframe (default: 1D).
Current Price × Volume: Live price × volume for the current bar.
Close × Max Volume (Lookback): Current close multiplied by the highest volume observed over a user-defined lookback period (default: 360 candles).
Relative Volume (RVOL %): Compares current volume with its moving average (default MA: 200) and shows the result as a percentage.
User Settings:
Toggle any of the 4 rows on/off
Customize the moving average length for RVOL
Choose the lookback period for highest volume
Select the timeframe for daily data
Use Case:
This tool helps traders:
Spot volume anomalies
Gauge institutional interest via RVOL
Identify high-liquidity conditions for entries/exits
Notes:
Table is positioned in the bottom-right corner
All values are auto-formatted (e.g., 1.5M, 3.2B)
Compatible with all instruments and timeframes
Nota Keluaran
Feature Added:- 1- Current candle volume change
2- Previous candle Volume change
Skrip sumber terbuka
Dalam semangat TradingView sebenar, pencipta skrip ini telah menjadikannya sumber terbuka, jadi pedagang boleh menilai dan mengesahkan kefungsiannya. Terima kasih kepada penulis! Walaupuan anda boleh menggunakan secara percuma, ingat bahawa penerbitan semula kod ini tertakluk kepada Peraturan Dalaman.
Penafian
Maklumat dan penerbitan adalah tidak bertujuan, dan tidak membentuk, nasihat atau cadangan kewangan, pelaburan, dagangan atau jenis lain yang diberikan atau disahkan oleh TradingView. Baca lebih dalam Terma Penggunaan.