OPEN-SOURCE SCRIPT
Kinetic Price Momentum Oscillator
📈 Kinetic Price Momentum Oscillator (Sri-PMO)
Author's Note:
This script is an educational and custom-adapted visualization based on the concept of the Price Momentum Oscillator (PMO). It is not a direct clone of any proprietary implementation, and it introduces enhancements such as timeframe sensitivity, customizable smoothings, multi-timeframe analysis, and visual trend meters.
🔍 Overview:
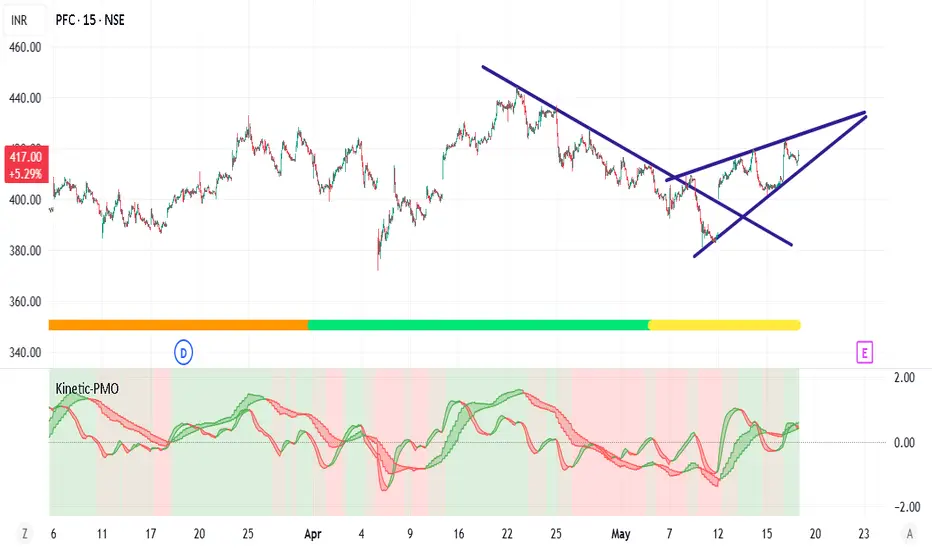
The Kinetic Price Momentum Oscillator (Kinetic-PMO) is a dynamic momentum indicator that analyzes price rate of change smoothed with dual exponential moving averages. It offers a clear view of momentum trends across multiple timeframes—the chart's current timeframe, the 1-hour timeframe, and the 1-day timeframe. It includes optional visual cues for zero-line crossovers, trend ribbon fills, and a daily trend meter.
🧮 Calculation Logic:
At its core, Kinetic-PMO calculates momentum by:
Measuring Rate of Change (ROC) over 1 bar.
Applying double EMA smoothing:
The first smoothing (len1) smooths the ROC.
The second smoothing (len2) smooths the result further.
This produces the main KPMO Line.
A third EMA (sigLen) is applied to the KPMO line to produce the Signal Line.
The formula includes a multiplier of 10 to scale values.
pinescript
Copy
Edit
roc = ta.roc(source, 1)
kmo = ta.ema(10 * ta.ema(roc, len1), len2)
signal = ta.ema(kmo, sigLen)
To allow responsiveness across timeframes, the script provides sensitivity inputs (sensA, sensB, sensC) which dynamically scale the smoothing lengths for different contexts:
Intraday (current chart timeframe)
Hourly (1H)
Daily (1D)
🧭 Features:
✅ Multi-Timeframe Calculation:
Intraday: Based on current chart resolution
1H: PMO for the hourly trend
1D: Daily trend meter using KPMO structure
✅ Trend Identification:
Green if PMO is above Signal Line (bullish)
Red if PMO is below Signal Line (bearish)
Daily Trend Meter includes nuanced color mapping:
Lime = Bullish above zero
Orange = Bullish below zero
Red = Bearish below zero
Yellow = Bearish above zero
✅ Custom Visual Enhancements:
Optional filled ribbons between KPMO and Signal
Optional zero-line crossover background highlight
Compact daily trend meter displayed as a color-coded shape
🛠 Customization Parameters:
Input Description
Primary Smoothing Controls ROC smoothing depth (1st EMA)
Secondary Smoothing Controls final smoothing (2nd EMA)
Signal Smoothing Controls EMA of the PMO line
Input Source Default is close, but any price type can be selected
Sensitivity Factors Separate multipliers for intraday, 1H, and 1D
Visual Settings Toggle zero-line highlight and ribbon fill
🧠 Intended Use:
The Kinetic-PMO is suitable for trend confirmation, momentum divergence detection, and entry/exit refinement. The multi-timeframe aspect helps align short-term and long-term momentum trends, supporting better trade decision-making.
⚖️ Legal & Attribution Statement:
This script was independently created and modified for educational and analytical purposes. While the concept of the PMO is inspired by technical analysis literature, this implementation does not copy or reverse-engineer any proprietary code. It introduces custom parameters, visualization enhancements, and multi-timeframe logic. Posting this script complies with TradingView’s policy on derivative work and educational indicators.
Author's Note:
This script is an educational and custom-adapted visualization based on the concept of the Price Momentum Oscillator (PMO). It is not a direct clone of any proprietary implementation, and it introduces enhancements such as timeframe sensitivity, customizable smoothings, multi-timeframe analysis, and visual trend meters.
🔍 Overview:
The Kinetic Price Momentum Oscillator (Kinetic-PMO) is a dynamic momentum indicator that analyzes price rate of change smoothed with dual exponential moving averages. It offers a clear view of momentum trends across multiple timeframes—the chart's current timeframe, the 1-hour timeframe, and the 1-day timeframe. It includes optional visual cues for zero-line crossovers, trend ribbon fills, and a daily trend meter.
🧮 Calculation Logic:
At its core, Kinetic-PMO calculates momentum by:
Measuring Rate of Change (ROC) over 1 bar.
Applying double EMA smoothing:
The first smoothing (len1) smooths the ROC.
The second smoothing (len2) smooths the result further.
This produces the main KPMO Line.
A third EMA (sigLen) is applied to the KPMO line to produce the Signal Line.
The formula includes a multiplier of 10 to scale values.
pinescript
Copy
Edit
roc = ta.roc(source, 1)
kmo = ta.ema(10 * ta.ema(roc, len1), len2)
signal = ta.ema(kmo, sigLen)
To allow responsiveness across timeframes, the script provides sensitivity inputs (sensA, sensB, sensC) which dynamically scale the smoothing lengths for different contexts:
Intraday (current chart timeframe)
Hourly (1H)
Daily (1D)
🧭 Features:
✅ Multi-Timeframe Calculation:
Intraday: Based on current chart resolution
1H: PMO for the hourly trend
1D: Daily trend meter using KPMO structure
✅ Trend Identification:
Green if PMO is above Signal Line (bullish)
Red if PMO is below Signal Line (bearish)
Daily Trend Meter includes nuanced color mapping:
Lime = Bullish above zero
Orange = Bullish below zero
Red = Bearish below zero
Yellow = Bearish above zero
✅ Custom Visual Enhancements:
Optional filled ribbons between KPMO and Signal
Optional zero-line crossover background highlight
Compact daily trend meter displayed as a color-coded shape
🛠 Customization Parameters:
Input Description
Primary Smoothing Controls ROC smoothing depth (1st EMA)
Secondary Smoothing Controls final smoothing (2nd EMA)
Signal Smoothing Controls EMA of the PMO line
Input Source Default is close, but any price type can be selected
Sensitivity Factors Separate multipliers for intraday, 1H, and 1D
Visual Settings Toggle zero-line highlight and ribbon fill
🧠 Intended Use:
The Kinetic-PMO is suitable for trend confirmation, momentum divergence detection, and entry/exit refinement. The multi-timeframe aspect helps align short-term and long-term momentum trends, supporting better trade decision-making.
⚖️ Legal & Attribution Statement:
This script was independently created and modified for educational and analytical purposes. While the concept of the PMO is inspired by technical analysis literature, this implementation does not copy or reverse-engineer any proprietary code. It introduces custom parameters, visualization enhancements, and multi-timeframe logic. Posting this script complies with TradingView’s policy on derivative work and educational indicators.
Skrip sumber terbuka
Dalam semangat TradingView sebenar, pencipta skrip ini telah menjadikannya sumber terbuka, jadi pedagang boleh menilai dan mengesahkan kefungsiannya. Terima kasih kepada penulis! Walaupuan anda boleh menggunakan secara percuma, ingat bahawa penerbitan semula kod ini tertakluk kepada Peraturan Dalaman.
Penafian
Maklumat dan penerbitan adalah tidak bertujuan, dan tidak membentuk, nasihat atau cadangan kewangan, pelaburan, dagangan atau jenis lain yang diberikan atau disahkan oleh TradingView. Baca lebih dalam Terma Penggunaan.