PROTECTED SOURCE SCRIPT
Superdupermegadeduper signals by BrenFX
🚀 Superdupermegadeduper Signals by BrenFX
Overview
The Superdupermegadeduper Signals indicator is a comprehensive trading system that combines multiple advanced technical analysis concepts to identify high-probability trading opportunities. This indicator integrates supply/demand zone analysis, dynamic trendline detection, and multi-confirmation signal generation to provide traders with precise entry, stop-loss, and take-profit levels.
🎯 Key Features
Supply & Demand Zone Detection
Intelligent Zone Identification: Automatically detects high-probability supply and demand zones based on price action and touch frequency
Customizable Zone Strength: Set minimum touches required for zone validation (2-10 touches)
Visual Zone Display: Clear visual representation with customizable colors and transparency
Zone Extension: Projects zones forward for future reference
Dynamic Trendline Analysis
Multi-Touch Trendline Detection: Identifies significant support and resistance trendlines with configurable minimum touch requirements
Automatic Trendline Drawing: Draws and extends trendlines automatically with custom colors
Deviation Tolerance: Configurable deviation percentage for trendline validation
Breakout & Retest Signals: Detects trendline breakouts and subsequent pullback retests
Advanced Signal Generation
Dual Signal Types:
Zone Reversal Signals: Based on supply/demand zone interactions
Trendline Breakout Signals: Based on trendline breaks with pullback confirmation
Multi-Confirmation System:
Volume confirmation (optional)
RSI filter integration
Candlestick pattern confirmation
Pullback verification
Professional Trade Management
Multiple Stop Loss Methods:
ATR-based dynamic stops
Zone-based stops
Fixed point stops
Automatic Level Calculation: Entry, stop-loss, and take-profit levels calculated automatically
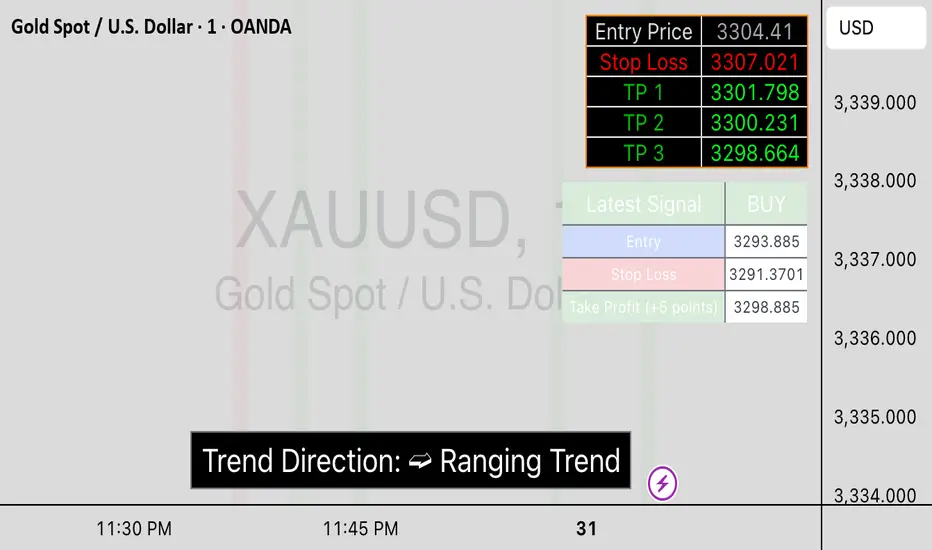
Real-Time Trade Table: Live display of current trade levels and parameters
Customizable Table Position: Place trade information anywhere on your chart
Alert System
Comprehensive Alerts: Get notified instantly when signals are generated
Detailed Alert Messages: Include entry price, stop-loss, and take-profit levels
Frequency Control: Once-per-bar alert frequency to avoid spam
📊 How It Works
Signal Logic
Zone Analysis: The indicator scans for areas where price has repeatedly found support or resistance
Trendline Detection: Identifies significant trend lines by connecting pivot points with multiple touches
Confirmation Process: Multiple filters ensure signal quality:
Price action confirmation (multiple bullish/bearish candles)
Volume above average (optional)
RSI oversold/overbought conditions (optional)
Entry Timing: Signals are generated when all confirmations align
Buy Signals Generated When:
Price reaches a demand zone with bullish reversal confirmation, OR
Price breaks above resistance trendline and retests successfully
Sell Signals Generated When:
Price reaches a supply zone with bearish reversal confirmation, OR
Price breaks below support trendline and retests successfully
⚙️ Configuration Options
Supply/Demand Settings
Zone Strength: Minimum touches required (2-10)
Lookback Period: Historical bars to analyze (10-100)
Zone Extension: Forward projection length (1-20 bars)
Trendline Settings
Lookback Period: Historical analysis range (20-200 bars)
Minimum Touches: Required pivot connections (2-5)
Deviation Tolerance: Allowable price variance (0.01-1.0%)
Signal Filters
Reversal Confirmation: Required confirmation candles (1-5)
Pullback Confirmation: Retest validation period (1-5)
Volume Filter: Above-average volume requirement
RSI Filter: Overbought/oversold confirmation
Trade Management
Stop Loss Methods: ATR, Zone-based, or Fixed points
ATR Multiplier: Risk adjustment (0.5-5.0x)
Take Profit: Fixed point target (1.0-50.0 points)
📈 Best Practices
Recommended Settings
For Scalping: Lower zone strength (2-3), shorter lookback periods
For Swing Trading: Higher zone strength (4-6), longer lookback periods
For Trend Following: Enable trendline signals, use ATR-based stops
Risk Management
Always use the provided stop-loss levels
Consider position sizing based on stop-loss distance
Monitor the trade table for real-time level updates
Use alerts to avoid missing opportunities
🎨 Visual Elements
Supply Zones: Red semi-transparent rectangles
Demand Zones: Green semi-transparent rectangles
Resistance Lines: Red trendlines
Support Lines: Green trendlines
Buy Signals: Green "BUY" labels below bars
Sell Signals: Red "SELL" labels above bars
Trade Table: Comprehensive trade information display
💡 Tips for Success
Combine with Market Structure: Use on clean trends and at key support/resistance levels
Multiple Timeframe Analysis: Confirm signals on higher timeframes
Volume Confirmation: Enable volume filter for higher quality signals
Risk Management: Never risk more than 1-2% per trade
Backtesting: Test settings on historical data before live trading
⚠️ Important Notes
This indicator works best in trending markets
Signals are more reliable when multiple confirmations align
Always consider fundamental analysis and market conditions
Past performance does not guarantee future results
Practice proper risk management at all times
🔧 Technical Specifications
Pine Script Version: 6
Overlay: Yes
Max Objects: 500 boxes, 500 lines
Performance: Optimized for real-time analysis
Compatibility: Works on all timeframes and instruments
Developed by BrenFX | Advanced Trading Signals for Professional Traders
Remember: Trading involves risk. This indicator is a tool to assist in analysis and should not be the sole basis for trading decisions. Always use proper risk management and consider your financial situation before trading.
Overview
The Superdupermegadeduper Signals indicator is a comprehensive trading system that combines multiple advanced technical analysis concepts to identify high-probability trading opportunities. This indicator integrates supply/demand zone analysis, dynamic trendline detection, and multi-confirmation signal generation to provide traders with precise entry, stop-loss, and take-profit levels.
🎯 Key Features
Supply & Demand Zone Detection
Intelligent Zone Identification: Automatically detects high-probability supply and demand zones based on price action and touch frequency
Customizable Zone Strength: Set minimum touches required for zone validation (2-10 touches)
Visual Zone Display: Clear visual representation with customizable colors and transparency
Zone Extension: Projects zones forward for future reference
Dynamic Trendline Analysis
Multi-Touch Trendline Detection: Identifies significant support and resistance trendlines with configurable minimum touch requirements
Automatic Trendline Drawing: Draws and extends trendlines automatically with custom colors
Deviation Tolerance: Configurable deviation percentage for trendline validation
Breakout & Retest Signals: Detects trendline breakouts and subsequent pullback retests
Advanced Signal Generation
Dual Signal Types:
Zone Reversal Signals: Based on supply/demand zone interactions
Trendline Breakout Signals: Based on trendline breaks with pullback confirmation
Multi-Confirmation System:
Volume confirmation (optional)
RSI filter integration
Candlestick pattern confirmation
Pullback verification
Professional Trade Management
Multiple Stop Loss Methods:
ATR-based dynamic stops
Zone-based stops
Fixed point stops
Automatic Level Calculation: Entry, stop-loss, and take-profit levels calculated automatically
Real-Time Trade Table: Live display of current trade levels and parameters
Customizable Table Position: Place trade information anywhere on your chart
Alert System
Comprehensive Alerts: Get notified instantly when signals are generated
Detailed Alert Messages: Include entry price, stop-loss, and take-profit levels
Frequency Control: Once-per-bar alert frequency to avoid spam
📊 How It Works
Signal Logic
Zone Analysis: The indicator scans for areas where price has repeatedly found support or resistance
Trendline Detection: Identifies significant trend lines by connecting pivot points with multiple touches
Confirmation Process: Multiple filters ensure signal quality:
Price action confirmation (multiple bullish/bearish candles)
Volume above average (optional)
RSI oversold/overbought conditions (optional)
Entry Timing: Signals are generated when all confirmations align
Buy Signals Generated When:
Price reaches a demand zone with bullish reversal confirmation, OR
Price breaks above resistance trendline and retests successfully
Sell Signals Generated When:
Price reaches a supply zone with bearish reversal confirmation, OR
Price breaks below support trendline and retests successfully
⚙️ Configuration Options
Supply/Demand Settings
Zone Strength: Minimum touches required (2-10)
Lookback Period: Historical bars to analyze (10-100)
Zone Extension: Forward projection length (1-20 bars)
Trendline Settings
Lookback Period: Historical analysis range (20-200 bars)
Minimum Touches: Required pivot connections (2-5)
Deviation Tolerance: Allowable price variance (0.01-1.0%)
Signal Filters
Reversal Confirmation: Required confirmation candles (1-5)
Pullback Confirmation: Retest validation period (1-5)
Volume Filter: Above-average volume requirement
RSI Filter: Overbought/oversold confirmation
Trade Management
Stop Loss Methods: ATR, Zone-based, or Fixed points
ATR Multiplier: Risk adjustment (0.5-5.0x)
Take Profit: Fixed point target (1.0-50.0 points)
📈 Best Practices
Recommended Settings
For Scalping: Lower zone strength (2-3), shorter lookback periods
For Swing Trading: Higher zone strength (4-6), longer lookback periods
For Trend Following: Enable trendline signals, use ATR-based stops
Risk Management
Always use the provided stop-loss levels
Consider position sizing based on stop-loss distance
Monitor the trade table for real-time level updates
Use alerts to avoid missing opportunities
🎨 Visual Elements
Supply Zones: Red semi-transparent rectangles
Demand Zones: Green semi-transparent rectangles
Resistance Lines: Red trendlines
Support Lines: Green trendlines
Buy Signals: Green "BUY" labels below bars
Sell Signals: Red "SELL" labels above bars
Trade Table: Comprehensive trade information display
💡 Tips for Success
Combine with Market Structure: Use on clean trends and at key support/resistance levels
Multiple Timeframe Analysis: Confirm signals on higher timeframes
Volume Confirmation: Enable volume filter for higher quality signals
Risk Management: Never risk more than 1-2% per trade
Backtesting: Test settings on historical data before live trading
⚠️ Important Notes
This indicator works best in trending markets
Signals are more reliable when multiple confirmations align
Always consider fundamental analysis and market conditions
Past performance does not guarantee future results
Practice proper risk management at all times
🔧 Technical Specifications
Pine Script Version: 6
Overlay: Yes
Max Objects: 500 boxes, 500 lines
Performance: Optimized for real-time analysis
Compatibility: Works on all timeframes and instruments
Developed by BrenFX | Advanced Trading Signals for Professional Traders
Remember: Trading involves risk. This indicator is a tool to assist in analysis and should not be the sole basis for trading decisions. Always use proper risk management and consider your financial situation before trading.
Skrip dilindungi
Skrip ini diterbitkan sebagai sumber tertutup. Akan tetapi, anda boleh menggunakannya secara bebas dan tanpa apa-apa had – ketahui lebih di sini.
Penafian
Maklumat dan penerbitan adalah tidak bertujuan, dan tidak membentuk, nasihat atau cadangan kewangan, pelaburan, dagangan atau jenis lain yang diberikan atau disahkan oleh TradingView. Baca lebih dalam Terma Penggunaan.