OPEN-SOURCE SCRIPT
Telah dikemas kini [blackcat] L2 Sine-Weighted Moving Average (SWMA)
Level: 2
Background
Invented by Patrick Lafferty in 1999, a Sine Weighted Moving Average (SWMA) takes its weighting from the first half of a Sine wave cycle and accordingly, the most weighting is given to the data in the middle of the data set. It is therefore very similar to the Triangular Moving Average.
Function
A sine weighted moving average (Sine-MA) applies weights to each bar in the shape of the bulge in a sine curve from 0 to pi. For an N-bar average the weightings are
/ 1 \ / 2 \ / N \
sin | --- * pi |, sin | --- * pi |, ..., sin | --- * pi |
\ N+1 / \ N+1 / \ N+1 /
The effect is that middle prices have the greatest weight (much like the TMA, Triangular Moving Average). A Sine Weighted Moving Average ( Sine WMA ) takes its weighting from the first half of a Sine wave cycle and accordingly, the most weighting is given to the data in the middle of the data set.
Key Signal
SWMA(FastLength) --> SWMA Fast Line.
SWMA(SlowLength) --> SWMA Slow Line.
Remarks
This is a Level 2 free and open source indicator.
Feedbacks are appreciated.
Nota Keluaran
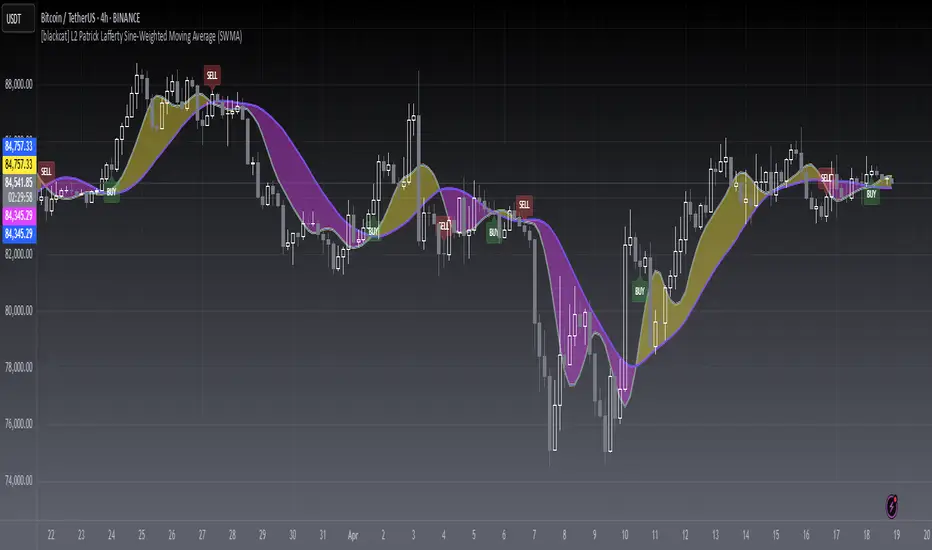
**OVERVIEW**This indicator implements Patrick Lafferty's Sine-Weighted Moving Average (SWMA), a sophisticated technical analysis tool designed to filter out noise while maintaining sensitivity to price movements 📈📉. It utilizes a unique sine-weighting algorithm to assign varying importance to different time periods within each calculation window ⚖️.
The script features dual-timeframe averaging capabilities through adjustable fast and slow periods, creating clear visual signals for trend identification and potential entry points 🔄.
FEATURES
• Customizable Price Source selection [bold]close, open, high, or low[/bold]
• Adjustable Fast & Slow Periods with default values set at 8 and 21 respectively
• Visually striking crossover/crossunder alerts using BUY/SSELL labels ❗
• Real-time histogram coloring reflecting relative position of indicators ✨
• Alert functionality for automated trade notifications 🔔
HOW TO USE
Add the indicator to your chart using the "Add Strategy" button ➕
Adjust the timeframe settings as per your trading strategy requirements 🎯
Monitor the interaction between the yellow (fast) and purple (slow) lines
Watch for crossovers: • Green UPWARD arrows indicate potential buying opportunities 💰 • Red DOWNWARD arrows suggest possible selling moments 📉
TIPS AND NOTES
• Higher period lengths will produce smoother signals but may lag more during volatile markets ⏳
• Lower period lengths increase responsiveness but might generate false signals in choppy environments 😐
• Ideal for both intraday scalping and medium-term swing trading strategies 📊
• Consider combining with volume indicators for enhanced accuracy ✅
LIMITATIONS
⚠️ No built-in stop-loss management
⚠️ Does not account for market depth/volume effects
⚠️ Performance may vary across different asset classes
Skrip sumber terbuka
Dalam semangat TradingView sebenar, pencipta skrip ini telah menjadikannya sumber terbuka, jadi pedagang boleh menilai dan mengesahkan kefungsiannya. Terima kasih kepada penulis! Walaupuan anda boleh menggunakan secara percuma, ingat bahawa penerbitan semula kod ini tertakluk kepada Peraturan Dalaman.
Avoid losing contact!Don't miss out! The first and most important thing to do is to join my Discord chat now! Click here to start your adventure: discord.com/invite/ZTGpQJq 防止失联,请立即行动,加入本猫聊天群: discord.com/invite/ZTGpQJq
Penafian
Maklumat dan penerbitan adalah tidak bertujuan, dan tidak membentuk, nasihat atau cadangan kewangan, pelaburan, dagangan atau jenis lain yang diberikan atau disahkan oleh TradingView. Baca lebih dalam Terma Penggunaan.