OPEN-SOURCE SCRIPT
Dual EMA Trend Ribbon (Multi-Timeframe Trend Confirmation)
Dual EMA Trend Ribbon (Multi-Timeframe Trend Confirmation)
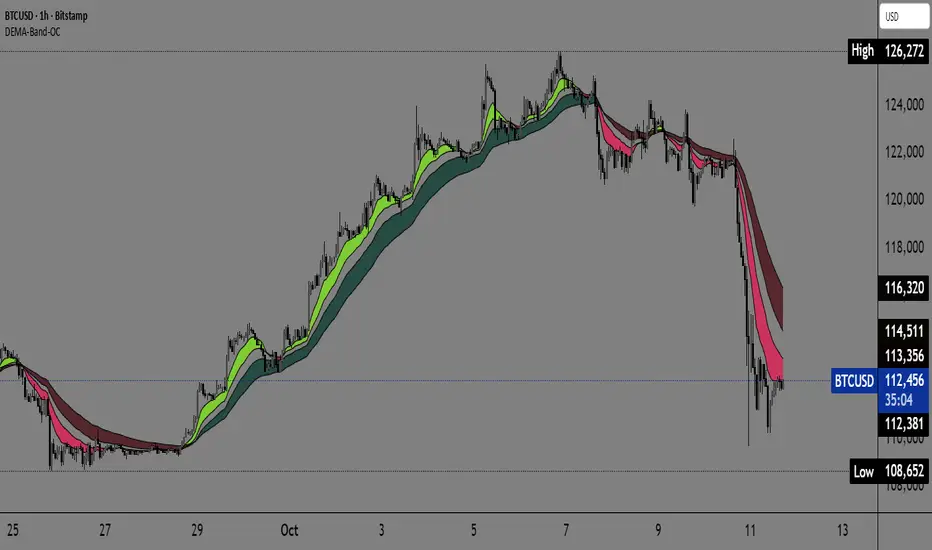
This Pine Script indicator creates a visually clear representation of trend direction using two overlaid Exponential Moving Average (EMA) Ribbons, which allows traders to assess both short-term and medium-term momentum at a glance.
How It Works:
The indicator plots two separate EMA ribbons, each calculated using a distinct set of periods, simulating a multi-timeframe approach on a single chart:
Inner (Fast) Ribbon (Defaults 10/30): Represents the fast-moving, short-term trend.
Green: Fast EMA 1 > Slow EMA 1 (Short-term Bullish)
Red: Fast EMA 1 < Slow EMA 1 (Short-term Bearish)
Outer (Slow) Ribbon (Defaults 40/50): Represents the slower, medium-term trend.
Darker Green/Red: Indicates the overall, underlying market bias.
How to Use:
Strong Trend Confirmation: A strong signal occurs when both ribbons are aligned (e.g., both are Green). This suggests that short-term momentum aligns with the medium-term bias.
Trend Weakness/Reversal: Pay attention when the two ribbons cross or when the fast ribbon changes color against the slow ribbon's color (e.g., fast ribbon turns Red while the slow ribbon remains Green). This often signals a temporary pullback or potential reversal of the underlying trend.
Settings: Users can easily adjust the four input periods (Fast EMA 1, Slow EMA 1, Fast EMA 2, Slow EMA 2) to customize the sensitivity to any trading style or asset.
Skrip sumber terbuka
Dalam semangat TradingView sebenar, pencipta skrip ini telah menjadikannya sumber terbuka, jadi pedagang boleh menilai dan mengesahkan kefungsiannya. Terima kasih kepada penulis! Walaupuan anda boleh menggunakan secara percuma, ingat bahawa penerbitan semula kod ini tertakluk kepada Peraturan Dalaman.
Free telegram channel t.me/alexmasterforex
Penafian
Maklumat dan penerbitan adalah tidak bertujuan, dan tidak membentuk, nasihat atau cadangan kewangan, pelaburan, dagangan atau jenis lain yang diberikan atau disahkan oleh TradingView. Baca lebih dalam Terma Penggunaan.