PROTECTED SOURCE SCRIPT
Telah dikemas kini Price/Moving Average
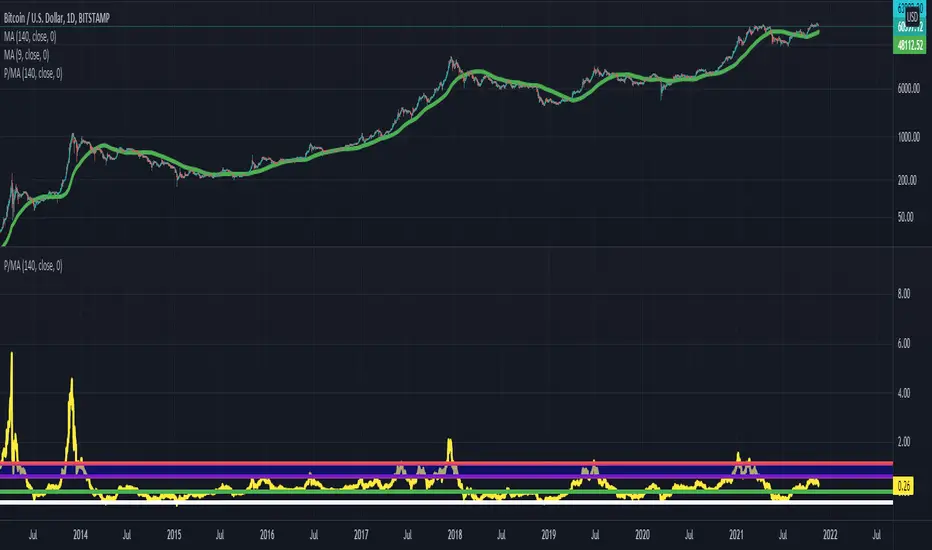
Price / Moving average indicator.
Support and resistance levels are established for Bitcoin.
When in a bear market, -50% below the 20 week MA acts as support.
When in a bull market, between 60% to 100% above the 20 week MA acts as resistance. Historically, these levels once hit, send Bitcoin back down to it's 20 week moving average.
In the setting of a bear market, historically, we do not ever get up to the 60% above the 20 week MA level.
Please note, this is only based on historical trends, and is not guaranteed to remain true in this or future market cycles.
Nota Keluaran
Remember, these values for support and resistance are not exact, in reality they vary by about 5-10% per cycle historically.Skrip dilindungi
Skrip ini diterbitkan sebagai sumber tertutup. Akan tetapi, anda boleh menggunakannya dengan percuma dan tanpa had – ketahui lebih lanjut di sini.
Penafian
Maklumat dan penerbitan adalah tidak dimaksudkan untuk menjadi, dan tidak membentuk, nasihat untuk kewangan, pelaburan, perdagangan dan jenis-jenis lain atau cadangan yang dibekalkan atau disahkan oleh TradingView. Baca dengan lebih lanjut di Terma Penggunaan.
Skrip dilindungi
Skrip ini diterbitkan sebagai sumber tertutup. Akan tetapi, anda boleh menggunakannya dengan percuma dan tanpa had – ketahui lebih lanjut di sini.
Penafian
Maklumat dan penerbitan adalah tidak dimaksudkan untuk menjadi, dan tidak membentuk, nasihat untuk kewangan, pelaburan, perdagangan dan jenis-jenis lain atau cadangan yang dibekalkan atau disahkan oleh TradingView. Baca dengan lebih lanjut di Terma Penggunaan.