PROTECTED SOURCE SCRIPT
Telah dikemas kini StockLeave Pullback
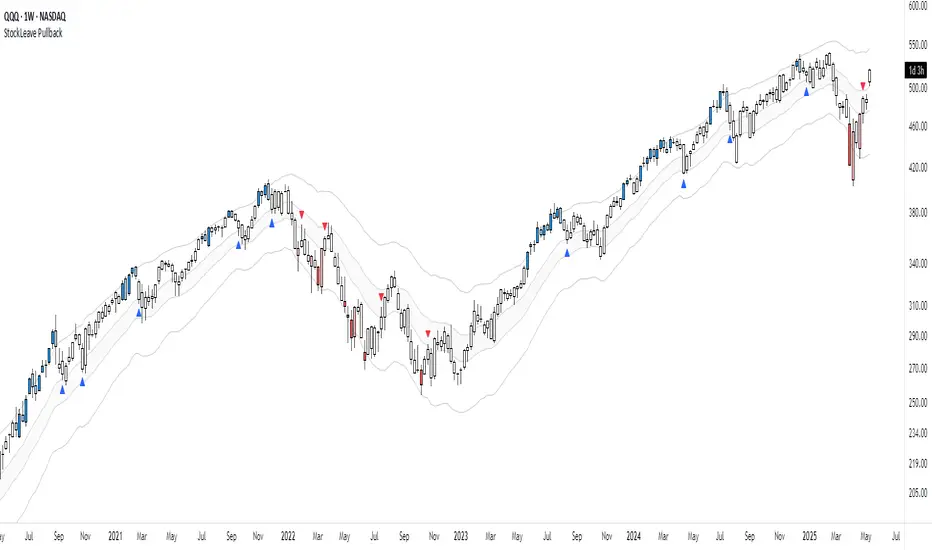
The indicator is made to locate pullbacks that occur in response to momentum moves. It shows potential pullback setups based on envelopes, mean spread conditions and price structure. It provides a reference for discretionary interpretation, not a replacement for it.
Momentum Condition
When price remains inside the envelope, it is considered normal behavior based on recent conditions. When price touches or exceeds the outer envelope, constructed from the mean ± ATR multiplier, it could indicate directional pressure. This suggests that price is moving with enough force to exceed its recent average range, which could correspond to meaningful momentum.

This marks a momentum move that could be of interest if a pullback develops.
Pullback Condition
After a momentum move has been identified, the indicator monitors for one of two standardized pullback conditions:

When either condition is met following a prior momentum move, a triangle is plotted on the chart to indicate that a pullback has occurred. This is limited to one signal per condition for each momentum move.
Applied Discretion
These visual cues do not imply that an entry should be taken; they simply indicate that a pullback location has been reached in response to a momentum move. Manual evaluation is still required to determine whether the setup aligns with structure and context:
If these conditions are met, entries can be made based on a preferred execution pattern, such as a break above or below the prior bar.
Trend Reversal
This indicator is made to locate pullbacks in response to a momentum move. It does not aim to capture a trend reversal phase, as those moves often require further price movement before structure can be confirmed. For this reason, there will be no plots in the earlier phase since price will not exceed the envelope.
The better approach for those scenarios is to observe price action in combination with the Momentum H/L indicator, which measures changes in momentum and highlights extremes that could lead to initiation or exhaustion.
Settings Overview
Pullback Mode
Show Envelope: Toggle envelope visibility
Show Mean Zone: Toggle mean zone visibility
Bar Colors: Set colors for bars during momentum moves
Momentum Condition
When price remains inside the envelope, it is considered normal behavior based on recent conditions. When price touches or exceeds the outer envelope, constructed from the mean ± ATR multiplier, it could indicate directional pressure. This suggests that price is moving with enough force to exceed its recent average range, which could correspond to meaningful momentum.
- Blue colors show upward momentum
- Red colors show downward momentum
This marks a momentum move that could be of interest if a pullback develops.
Pullback Condition
After a momentum move has been identified, the indicator monitors for one of two standardized pullback conditions:
- A reversion to the mean zone, low threshold ATR around the mean value
- A zero-line spread convergence, where the difference between two MA’s contracts near zero
When either condition is met following a prior momentum move, a triangle is plotted on the chart to indicate that a pullback has occurred. This is limited to one signal per condition for each momentum move.
Applied Discretion
These visual cues do not imply that an entry should be taken; they simply indicate that a pullback location has been reached in response to a momentum move. Manual evaluation is still required to determine whether the setup aligns with structure and context:
- Whether the trend structure remains intact
- Whether the pullback is controlled
- Whether the trade aligns with the broader context
If these conditions are met, entries can be made based on a preferred execution pattern, such as a break above or below the prior bar.
Trend Reversal
This indicator is made to locate pullbacks in response to a momentum move. It does not aim to capture a trend reversal phase, as those moves often require further price movement before structure can be confirmed. For this reason, there will be no plots in the earlier phase since price will not exceed the envelope.
The better approach for those scenarios is to observe price action in combination with the Momentum H/L indicator, which measures changes in momentum and highlights extremes that could lead to initiation or exhaustion.
Settings Overview
Pullback Mode
- None: No triangles plotted (default)
- Mean Zone: Triangle when price pulls back into the mean zone
- Zero Line: Triangle when moving average spread contracts near zero
- Dual: Plots one triangle per momentum move, based on the first condition met
Show Envelope: Toggle envelope visibility
Show Mean Zone: Toggle mean zone visibility
Bar Colors: Set colors for bars during momentum moves
Nota Keluaran
Default: Dual ModeSkrip dilindungi
Skrip ini diterbitkan sebagai sumber tertutup. Akan tetapi, anda boleh menggunakannya secara bebas dan tanpa apa-apa had – ketahui lebih di sini.
Technical Trading: Research and Application
stockleave.com/
stockleave.com/
Penafian
Maklumat dan penerbitan adalah tidak bertujuan, dan tidak membentuk, nasihat atau cadangan kewangan, pelaburan, dagangan atau jenis lain yang diberikan atau disahkan oleh TradingView. Baca lebih dalam Terma Penggunaan.
Skrip dilindungi
Skrip ini diterbitkan sebagai sumber tertutup. Akan tetapi, anda boleh menggunakannya secara bebas dan tanpa apa-apa had – ketahui lebih di sini.
Technical Trading: Research and Application
stockleave.com/
stockleave.com/
Penafian
Maklumat dan penerbitan adalah tidak bertujuan, dan tidak membentuk, nasihat atau cadangan kewangan, pelaburan, dagangan atau jenis lain yang diberikan atau disahkan oleh TradingView. Baca lebih dalam Terma Penggunaan.