PROTECTED SOURCE SCRIPT
Telah dikemas kini Ollie_allcaps Momentum Indicator
Momentum is created when a security makes a large move on higher-than-average volume. Momentum shows the rate of change in price movement over a period of time to help investors determine the strength of a trend.
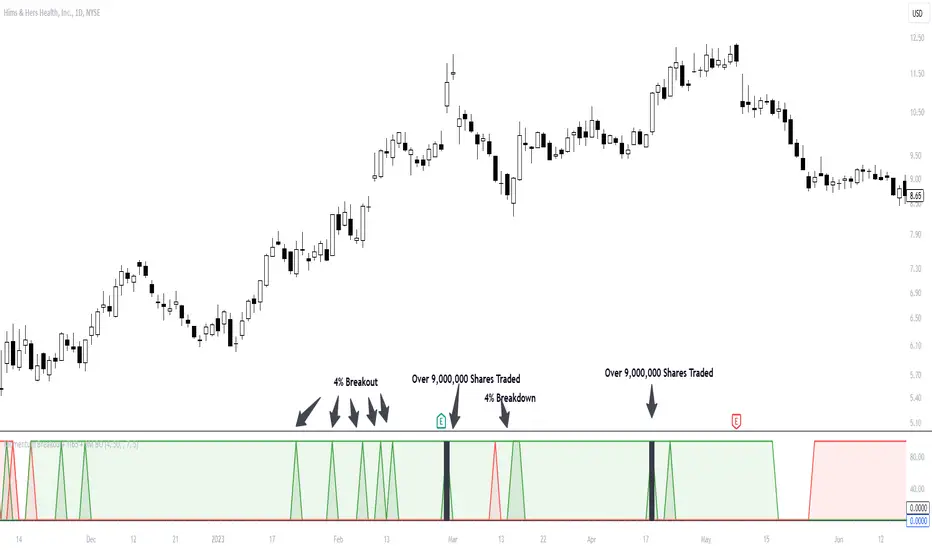
This indicator will create a green spike once price advances 4% and is trading above the 50-day average trading volume. However, if the stock begins to breakdown (-4% or greater on above average volume), a red spike will be created.
These green and red spikes represent a change in momentum that occurs in the selected security.
This indictor should be used in 2 ways:
1: What are the charecteristics of this stock? Does it breakdown shortly after a momentum spike? or does the security trend in orderly manner after a momentum spike?
2: Investers should use this indicator to determine the strength of a momentum breakout in real time. Has the stock made a large move, but with no significant volume?
Customization:
The Percentage move, and average daily volume can be changed as well as colors.
Alerts:
If you wish to set an alert, this indicator allows you to create an alert when the selected stock meets your desired criteria.
Nota Keluaran
The recent addition to this momentum Indicator is the addition of the Trend Intensity 65 (TI65). TI65 measure how Intense the trend is by signaling when the 7-period moving average is greater than 5% above the 65-period moving average. This information is important when determining not only if the stock is in an uptrend, but how INTENSE the trend is.
Using both the 4% breakout signal AND the TI65 together, traders will have a very clear picture of a stock making a strong momentum move. Traders can use this information to find low risk opportunities during the strong trend. Finally, when a stock is in an intense uptrend AND breaking out on high volume, traders will have an edge using this indicator.
Nota Keluaran
Popularized by Stockbee, the 9 million breakout can be used by momentum traders who are seeking to improve their breakout trading. When a stock begins to trade 9 million shares while breaking out, this can signal serious accumulation.Traders can quickly identify if a breakout is high quality or not by the number of shares being traded. This additional feature in this indicator plots a black bar to help traders visually see when 4% breakouts/downs occur and when a 9 million share breakout is underway.
This indicator is the full package for traders who want to quickly read price action and improve their momentum burst trading.
Nota Keluaran
Fixed a bug within the codeNota Keluaran
Fixed chart and Indicator name Nota Keluaran
The 9 million breakout is now behind the 4% breakout/ down. This is a simple adjustment for more appealing visuals. Skrip dilindungi
Skrip ini diterbitkan sebagai sumber tertutup. Akan tetapi, anda boleh menggunakannya secara bebas dan tanpa apa-apa had – ketahui lebih di sini.
Penafian
Maklumat dan penerbitan adalah tidak bertujuan, dan tidak membentuk, nasihat atau cadangan kewangan, pelaburan, dagangan atau jenis lain yang diberikan atau disahkan oleh TradingView. Baca lebih dalam Terma Penggunaan.
Skrip dilindungi
Skrip ini diterbitkan sebagai sumber tertutup. Akan tetapi, anda boleh menggunakannya secara bebas dan tanpa apa-apa had – ketahui lebih di sini.
Penafian
Maklumat dan penerbitan adalah tidak bertujuan, dan tidak membentuk, nasihat atau cadangan kewangan, pelaburan, dagangan atau jenis lain yang diberikan atau disahkan oleh TradingView. Baca lebih dalam Terma Penggunaan.