OPEN-SOURCE SCRIPT
SMI-Darkness
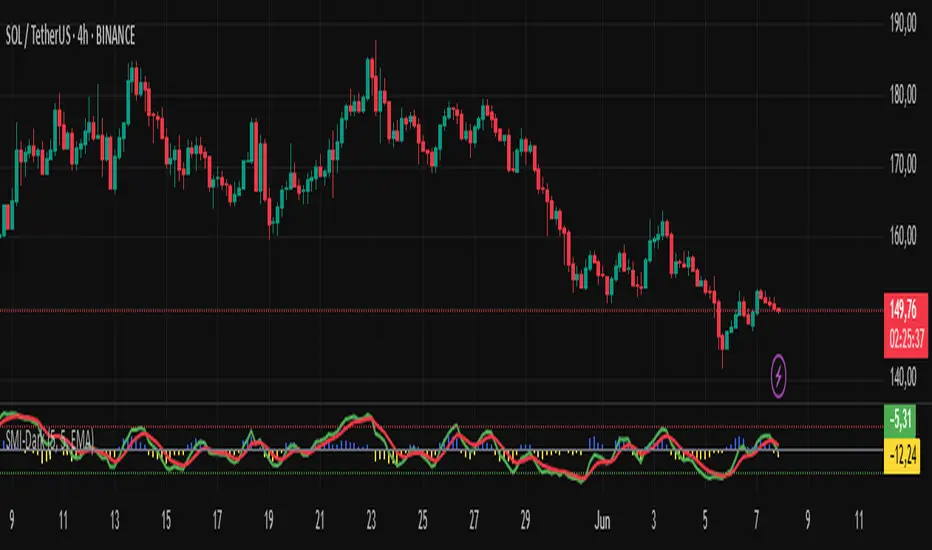
Indicator Description: SMI-Darkness
The SMI-Darkness is an indicator based on the Stochastic Momentum Index (SMI), designed to help identify the strength and direction of an asset's trend, as well as potential buy and sell signals. It displays a smoothed SMI using multiple moving average options to customize the indicator’s behavior according to the user’s trading style.
Main Features
Smoothed SMI: Calculates the traditional SMI and smooths it using a user-configurable moving average, improving signal clarity.
Signal Line: Displays a smoothed signal line to identify crossovers with the SMI, generating potential entry or exit points.
Histogram: Shows the difference between the smoothed SMI and the signal line, visually highlighting trend strength. Blue bars indicate buying strength, while yellow bars indicate selling strength.
Horizontal Lines: Includes overbought (+40) and oversold (-40) levels, plus a neutral zero level to aid interpretation.
Indicator Parameters
SMI Short Period: Sets the short period used to calculate the SMI (default 5). Lower periods make the indicator more sensitive.
SMI Signal Period: Sets the period to smooth the signal line (default 5). Adjust to control the signal line's smoothness.
Moving Average Type: Choose the moving average type to smooth the SMI and signal line. Options include:
SMA (Simple Moving Average)
SMMA (Smoothed Moving Average)
EMA (Exponential Moving Average)
WMA (Weighted Moving Average)
HMA (Hull Moving Average)
JMA (Jurik Moving Average) — Note: This is not an original or proprietary moving average but a publicly available open-source version created by TradingView users.
VWMA (Volume-Weighted Moving Average)
KAMA (Kaufman Adaptive Moving Average)
How to Use
Trend Identification: Observe the position of the smoothed SMI relative to the signal line and the histogram values.
When the histogram is positive (blue bars), momentum is bullish.
When the histogram is negative (yellow bars), momentum is bearish.
Buy and Sell Signals:
A crossover of the smoothed SMI above the signal line may indicate a buy signal.
A crossover of the smoothed SMI below the signal line may indicate a sell signal.
Overbought/Oversold Levels:
SMI values above +40 suggest potential overbought conditions, signaling caution on long positions.
Values below -40 suggest potential oversold conditions, indicating possible buying opportunities.
Customization: Adjust the parameters to balance sensitivity and noise, choosing the moving average type that best fits your trading style.
Skrip sumber terbuka
Dalam semangat TradingView sebenar, pencipta skrip ini telah menjadikannya sumber terbuka, jadi pedagang boleh menilai dan mengesahkan kefungsiannya. Terima kasih kepada penulis! Walaupuan anda boleh menggunakan secara percuma, ingat bahawa penerbitan semula kod ini tertakluk kepada Peraturan Dalaman.
Penafian
Maklumat dan penerbitan adalah tidak bertujuan, dan tidak membentuk, nasihat atau cadangan kewangan, pelaburan, dagangan atau jenis lain yang diberikan atau disahkan oleh TradingView. Baca lebih dalam Terma Penggunaan.