OPEN-SOURCE SCRIPT
Fractal Dimension Index (FDI) by CoryP1990 – Quant Toolkit
The Fractal Dimension Index (FDI) quantifies how directional or choppy price movement is; in other words, it measures the “roughness” of a trend. FDI values near 1.0–1.3 indicate strong directional trends, while values near 1.5–2.0 reflect chaotic or range-bound behavior. This makes FDI a powerful tool for detecting trend vs. mean-reversion regimes.
How it works
Calculates the ratio of average price changes over full and half-length windows to estimate the fractal dimension of price movement.
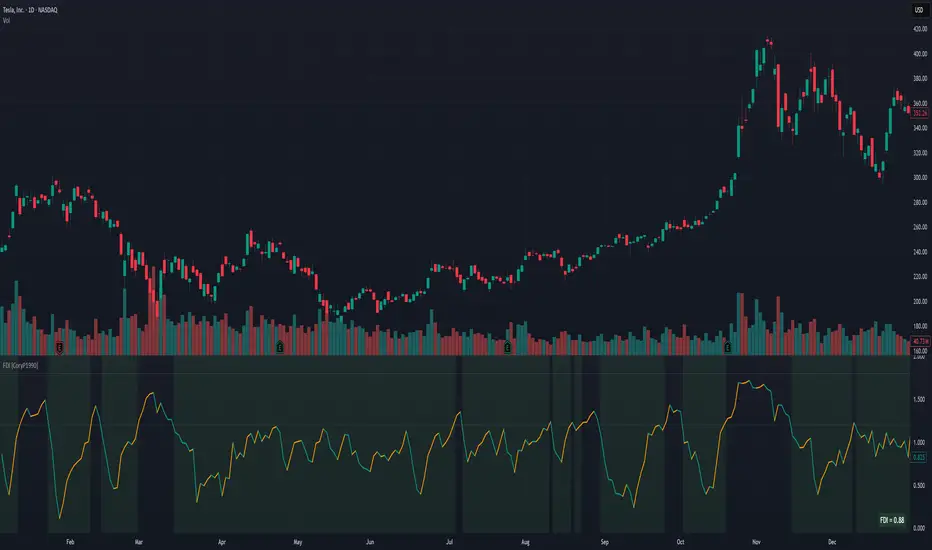
Teal line = FDI decreasing → trending behavior (market smoother, more directional).
Orange line = FDI increasing → choppiness or consolidation.
Background:
Green tint = trend-friendly regime (FDI below low threshold).
Orange tint = choppy regime (FDI above high threshold).
Use cases
Detect when markets shift from trend-following to mean-reverting conditions.
Filter trades: favor trend strategies when FDI < 1.3 and reversion setups when FDI > 1.7.
Combine with momentum or volatility metrics to classify regimes.
Defaults
Length = 20
High-FDI threshold = 1.8
Low-FDI threshold = 1.2
Example — TSLA (1D, 2021)
Early 2021 trades choppy to sideways with FDI swinging up toward 1.5, then the index drops below 1.2 as Tesla transitions into a persistent trend-friendly regime through the second half of the year (green background). During the Q4 breakout, FDI holds ~1.0–1.2, confirming strong directionality; brief pullbacks lift FDI back toward the mid-range before trending pressure resumes. At the right edge, FDI sits well below the low threshold, signaling that price remains in a trend-supportive state.
Part of the Quant Toolkit — transparent, open-source indicators for modern quantitative analysis. Built by CoryP1990.
How it works
Calculates the ratio of average price changes over full and half-length windows to estimate the fractal dimension of price movement.
Teal line = FDI decreasing → trending behavior (market smoother, more directional).
Orange line = FDI increasing → choppiness or consolidation.
Background:
Green tint = trend-friendly regime (FDI below low threshold).
Orange tint = choppy regime (FDI above high threshold).
Use cases
Detect when markets shift from trend-following to mean-reverting conditions.
Filter trades: favor trend strategies when FDI < 1.3 and reversion setups when FDI > 1.7.
Combine with momentum or volatility metrics to classify regimes.
Defaults
Length = 20
High-FDI threshold = 1.8
Low-FDI threshold = 1.2
Example — TSLA (1D, 2021)
Early 2021 trades choppy to sideways with FDI swinging up toward 1.5, then the index drops below 1.2 as Tesla transitions into a persistent trend-friendly regime through the second half of the year (green background). During the Q4 breakout, FDI holds ~1.0–1.2, confirming strong directionality; brief pullbacks lift FDI back toward the mid-range before trending pressure resumes. At the right edge, FDI sits well below the low threshold, signaling that price remains in a trend-supportive state.
Part of the Quant Toolkit — transparent, open-source indicators for modern quantitative analysis. Built by CoryP1990.
Skrip sumber terbuka
Dalam semangat sebenar TradingView, pencipta skrip ini telah menjadikannya sumber terbuka supaya pedagang dapat menilai dan mengesahkan kefungsiannya. Terima kasih kepada penulis! Walaupun anda boleh menggunakannya secara percuma, ingat bahawa menerbitkan semula kod ini adalah tertakluk kepada Peraturan Dalaman kami.
Quant finance researcher focused on options, volatility modeling, and derivative pricing. Building tools that turn complex market behavior into clear, data-driven insights. Explore analytics and modeling at OptionsAnalysisSuite.com
Penafian
Maklumat dan penerbitan adalah tidak dimaksudkan untuk menjadi, dan tidak membentuk, nasihat untuk kewangan, pelaburan, perdagangan dan jenis-jenis lain atau cadangan yang dibekalkan atau disahkan oleh TradingView. Baca dengan lebih lanjut di Terma Penggunaan.