OPEN-SOURCE SCRIPT
J Weighted Average Price
📘 How to Use the OBV VWAP Reentry Signal Effectively
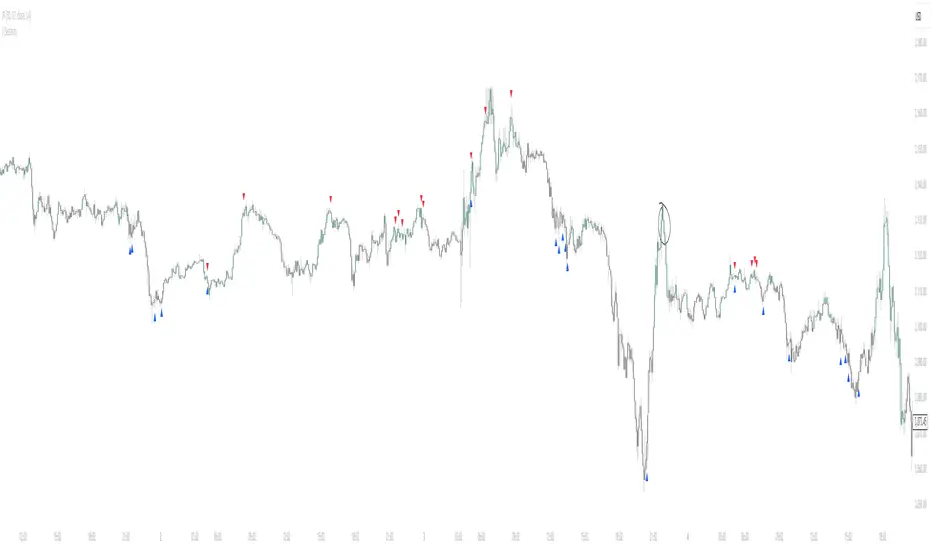
This indicator plots a VWAP based on OBV (On-Balance Volume), along with dynamic bands to identify overbought and oversold conditions in volume flow.
🔺 Red Triangle Up: Appears when OBV crosses back below the upper band → Potential reversal from overbought → Watch for short opportunities.
🔻 Blue Triangle Down: Appears when OBV crosses back above the lower band → Potential reversal from oversold → Watch for long opportunities.
📌 Tip: Use these signals in confluence with price action or trend confirmation to filter false signals. For example:
Enter short after a reentry from upper band and a lower high in price.
Enter long after a reentry from lower band and a bullish candle structure.
This setup helps you catch mean reversion moves based on volume flow, not just price.
Skrip sumber terbuka
Dalam semangat TradingView sebenar, pencipta skrip ini telah menjadikannya sumber terbuka, jadi pedagang boleh menilai dan mengesahkan kefungsiannya. Terima kasih kepada penulis! Walaupuan anda boleh menggunakan secara percuma, ingat bahawa penerbitan semula kod ini tertakluk kepada Peraturan Dalaman.
Penafian
Maklumat dan penerbitan adalah tidak bertujuan, dan tidak membentuk, nasihat atau cadangan kewangan, pelaburan, dagangan atau jenis lain yang diberikan atau disahkan oleh TradingView. Baca lebih dalam Terma Penggunaan.