OPEN-SOURCE SCRIPT
Fibonacci Structure & Trend Channel (Expo)
█ Overview
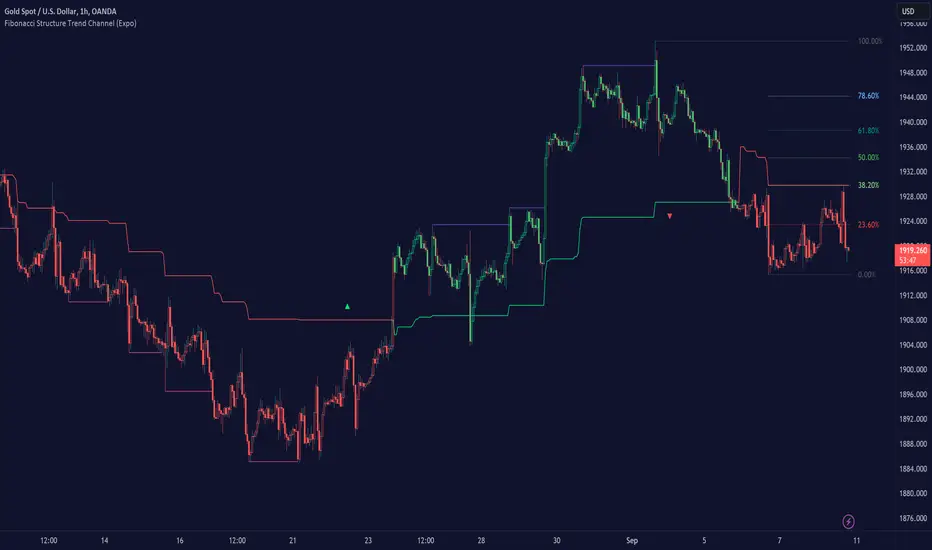
The Fibonacci Structure & Trend Channel (Expo) is designed to identify trend direction and potential reversal levels and offer insights into price structure based on Fibonacci ratios. The algorithm plots a Fibonacci channel, making it easier for traders to identify potential retracement points. Additionally, the Fibonacci market structure is plotted to enhance traders' understanding of the underlying order flow.

█ How to Use
Identify Trends
Use the plotted Fibonacci Trend Line to identify the direction of the market trend. A green line typically signifies a bullish trend, while a red line signifies a bearish trend.

Retracement Levels
The plotted Fibonacci levels can act as potential support or resistance levels. Look for price action signs at these levels for entry or exit points.

Channel Trading
If you enable the Fibonacci channel, the upper and lower bounds can act as overbought or oversold levels.

Market Structure
The plotted Fibonacci market structure serves as a valuable tool for dissecting the underlying order flow and gauging the strength or weakness of a trend. By analyzing these structures, traders can identify key levels where supply and demand intersect, which often act as pivotal points for trend reversals or accelerations. This visual representation simplifies complex market dynamics. Whether you're looking to catch a new trend early or seeking confirmation for a potential reversal, understanding the market structure plotted by the Fibonacci ratios can provide actionable insights for various trading strategies.

Use the Table
The information table can provide quick insights into the current trend and when it started.
█ Settings
-----------------
Disclaimer
The information contained in my Scripts/Indicators/Ideas/Algos/Systems does not constitute financial advice or a solicitation to buy or sell any securities of any type. I will not accept liability for any loss or damage, including without limitation any loss of profit, which may arise directly or indirectly from the use of or reliance on such information.
All investments involve risk, and the past performance of a security, industry, sector, market, financial product, trading strategy, backtest, or individual's trading does not guarantee future results or returns. Investors are fully responsible for any investment decisions they make. Such decisions should be based solely on an evaluation of their financial circumstances, investment objectives, risk tolerance, and liquidity needs.
My Scripts/Indicators/Ideas/Algos/Systems are only for educational purposes!
The Fibonacci Structure & Trend Channel (Expo) is designed to identify trend direction and potential reversal levels and offer insights into price structure based on Fibonacci ratios. The algorithm plots a Fibonacci channel, making it easier for traders to identify potential retracement points. Additionally, the Fibonacci market structure is plotted to enhance traders' understanding of the underlying order flow.
█ How to Use
Identify Trends
Use the plotted Fibonacci Trend Line to identify the direction of the market trend. A green line typically signifies a bullish trend, while a red line signifies a bearish trend.
Retracement Levels
The plotted Fibonacci levels can act as potential support or resistance levels. Look for price action signs at these levels for entry or exit points.
Channel Trading
If you enable the Fibonacci channel, the upper and lower bounds can act as overbought or oversold levels.
Market Structure
The plotted Fibonacci market structure serves as a valuable tool for dissecting the underlying order flow and gauging the strength or weakness of a trend. By analyzing these structures, traders can identify key levels where supply and demand intersect, which often act as pivotal points for trend reversals or accelerations. This visual representation simplifies complex market dynamics. Whether you're looking to catch a new trend early or seeking confirmation for a potential reversal, understanding the market structure plotted by the Fibonacci ratios can provide actionable insights for various trading strategies.
Use the Table
The information table can provide quick insights into the current trend and when it started.
█ Settings
- The Fibonacci settings allow traders to specify the Fibonacci retracement levels that will be used to calculate the trend and its channel.
- The Fibonacci Structure Trend Channel structure settings enable traders to fine-tune how the indicator identifies and plots the underlying price structure.
-----------------
Disclaimer
The information contained in my Scripts/Indicators/Ideas/Algos/Systems does not constitute financial advice or a solicitation to buy or sell any securities of any type. I will not accept liability for any loss or damage, including without limitation any loss of profit, which may arise directly or indirectly from the use of or reliance on such information.
All investments involve risk, and the past performance of a security, industry, sector, market, financial product, trading strategy, backtest, or individual's trading does not guarantee future results or returns. Investors are fully responsible for any investment decisions they make. Such decisions should be based solely on an evaluation of their financial circumstances, investment objectives, risk tolerance, and liquidity needs.
My Scripts/Indicators/Ideas/Algos/Systems are only for educational purposes!
Skrip sumber terbuka
Dalam semangat TradingView sebenar, pencipta skrip ini telah menjadikannya sumber terbuka, jadi pedagang boleh menilai dan mengesahkan kefungsiannya. Terima kasih kepada penulis! Walaupuan anda boleh menggunakan secara percuma, ingat bahawa penerbitan semula kod ini tertakluk kepada Peraturan Dalaman.
Access my indicators at: zeiierman.com
Join Our Free Discord: discord.gg/zeiiermantrading
Join Our Free Discord: discord.gg/zeiiermantrading
Penafian
Maklumat dan penerbitan adalah tidak bertujuan, dan tidak membentuk, nasihat atau cadangan kewangan, pelaburan, dagangan atau jenis lain yang diberikan atau disahkan oleh TradingView. Baca lebih dalam Terma Penggunaan.