OPEN-SOURCE SCRIPT
Telah dikemas kini PatronsitoP
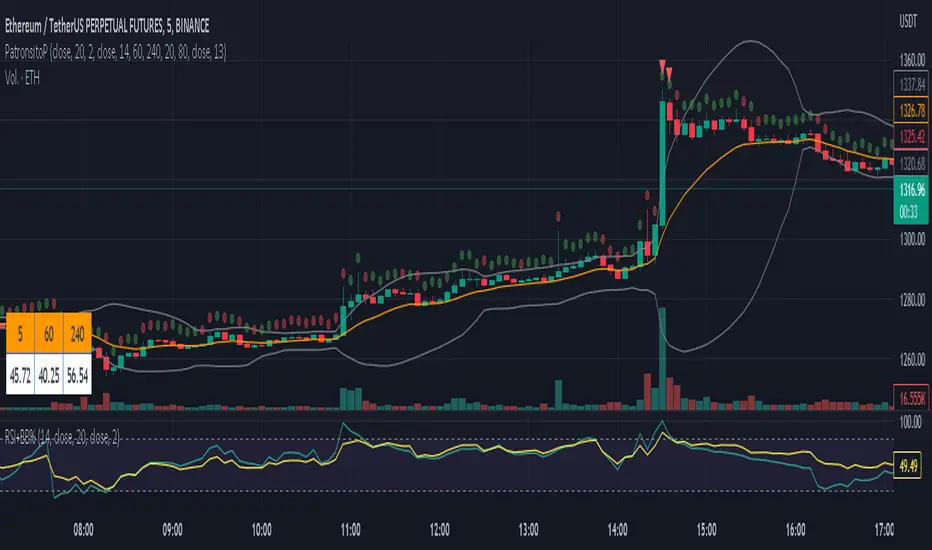
Indicator for the "Patrón Poderoso" strategy.
This strategy is based on Bollinger Bands and RSI and try to determine overbought or oversold zones where you can trade. Both indicators are combined to provide a stronger signal.
By default, it is considered an overbought zone when price is over BB upper and RSI above 80. That would be a short signal. Price below BB lower and RSI below 20 means an oversold zone and therefore a long signal.
EMA 13 (by default) is included as a guide for exiting the operation.
Alarms for signals in any direction can be used.
Nota Keluaran
Two features added:1) Added the possibility of plotting the middle band of the bollinger bands
2) Added two extra timefrimes to the RSI table. Since this script is mainly use in 5m, it's handy to have also a view of RSI on higher timeframes. By default you will be able to see RSI values of 1h and 4h but it's customizable
Nota Keluaran
Added possibility to plot OI (Open Interest) infomation per candle, which may help as another confirmation to know where the price can go.As always, everything is configurable and code is available. Happy profits!
Skrip sumber terbuka
Dalam semangat sebenar TradingView, pencipta skrip ini telah menjadikannya sumber terbuka supaya pedagang dapat menilai dan mengesahkan kefungsiannya. Terima kasih kepada penulis! Walaupun anda boleh menggunakannya secara percuma, ingat bahawa menerbitkan semula kod ini adalah tertakluk kepada Peraturan Dalaman kami.
Penafian
Maklumat dan penerbitan adalah tidak dimaksudkan untuk menjadi, dan tidak membentuk, nasihat untuk kewangan, pelaburan, perdagangan dan jenis-jenis lain atau cadangan yang dibekalkan atau disahkan oleh TradingView. Baca dengan lebih lanjut di Terma Penggunaan.