OPEN-SOURCE SCRIPT
Enhanced Predator Suite
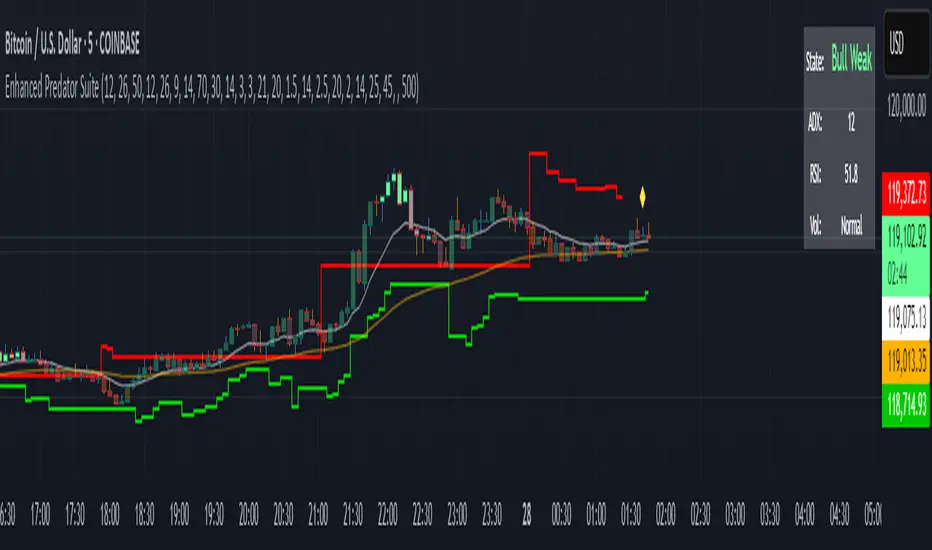
🎯 Simple Predator Suite Guide - What You See on Your Chart
📍 What to Look For RIGHT NOW on Your BTC Chart
1. BAR COLORS (Most Important)
Look at the color of each price bar:
🟢 BRIGHT GREEN = BUY SIGNAL (Bull Strong)
🟢 LIGHT GREEN = Weak buy (be careful)
🟠 ORANGE = Weak sell (take profits)
🔴 RED = SELL SIGNAL (Bear Strong)
⚫ GRAY = DON'T TRADE (choppy market)
2. TRIANGLE SIGNALS
These are your entry points:
▲ GREEN TRIANGLE UP = Enter LONG (buy) on next bar
▼ RED TRIANGLE DOWN = Enter SHORT (sell) on next bar
3. TRAILING STOP LINES
🟢 GREEN LINE = Exit your long trades if price hits this
🔴 RED LINE = Exit your short trades if price hits this
🚀 SUPER SIMPLE TRADING METHOD
FOR LONG TRADES (BUYING)
Wait for a green triangle ▲ to appear
Buy on the next candle
Set stop loss below the green line
Take profit when bars turn orange or red
FOR SHORT TRADES (SELLING)
Wait for a red triangle ▼ to appear
Sell on the next candle
Set stop loss above the red line
Take profit when bars turn light green or bright green
WHEN TO STAY OUT
Gray bars = Market is confused, don't trade
No triangles = No clear entry signal
Price far from lines = You missed the move
🚫 COMMON MISTAKES TO AVOID
DON'T Do These Things:
❌ Trade during gray bars (choppy market)
❌ Enter without seeing a triangle signal
❌ Ignore the trailing stop lines
❌ Trade with big position sizes at first
❌ Chase price if you missed the triangle
DO These Instead:
✅ Wait patiently for clear triangle signals
✅ Always use the stop loss lines
✅ Start with tiny position sizes
✅ Take profits when bar colors change
✅ Stay out during gray bar periods
Skrip sumber terbuka
Dalam semangat sebenar TradingView, pencipta skrip ini telah menjadikannya sumber terbuka supaya pedagang dapat menilai dan mengesahkan kefungsiannya. Terima kasih kepada penulis! Walaupun anda boleh menggunakannya secara percuma, ingat bahawa menerbitkan semula kod ini adalah tertakluk kepada Peraturan Dalaman kami.
Penafian
Maklumat dan penerbitan adalah tidak dimaksudkan untuk menjadi, dan tidak membentuk, nasihat untuk kewangan, pelaburan, perdagangan dan jenis-jenis lain atau cadangan yang dibekalkan atau disahkan oleh TradingView. Baca dengan lebih lanjut di Terma Penggunaan.