Ghost Vision III
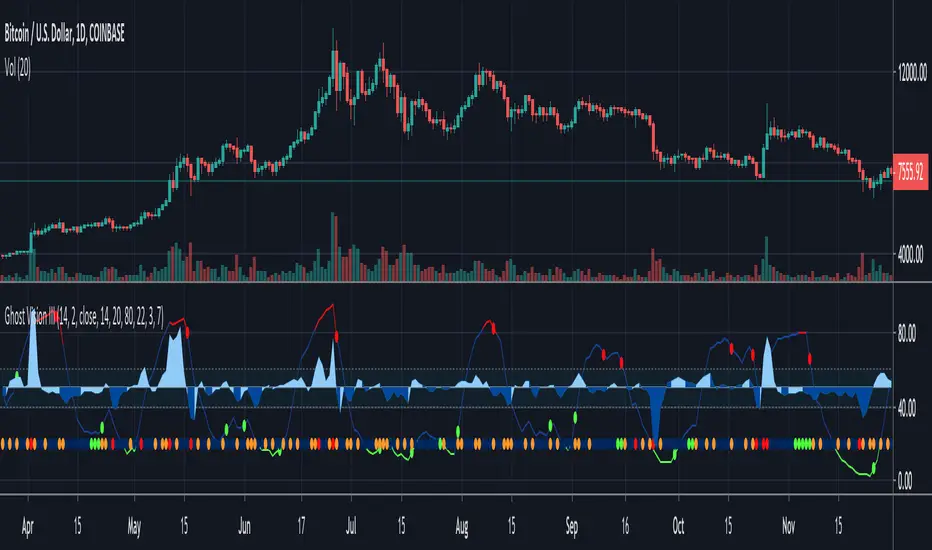
GhostVision III — Will answer you for the following questions:
Should I take a profit now?
The level amount of volume and price action?
Oversold or overbought?
Is it a pullback?
Can be used to:
Spot price moves that going to explode
Taking profit on extreme price movement
Spot fake price movements
Find pullback opportunities
Confirmations for GhostVision I & II
- Easier to use & see when and why we are overbought or oversold
- Double confirmation by line color and a dot (NEW)
For GhostVision Members:
Use it for a pullback strategy as an extra iceberg confirmation
Skrip jemputan sahaja
Hanya pengguna disahkan oleh penulis boleh mengakses skrip ini. Anda perlu memohon dan mendapatkan kebenaran untuk menggunakannya. Keizinan selalunya diberikan selepas pembayaran. Untuk lebih butiran, ikuti arahan penulis di bawah atau hubungi GhostVision secara terus.
TradingView TIDAK menyarankan pembayaran atau penggunaan skrip kecuali anda mempercayai sepenuhnya penulis dan memahami bagaimana ia berfungsi. Anda juga boleh menjumpai alternatif sumber terbuka dan percuma yang lain di dalam skrip komuniti kami.
Arahan penulis
Penafian
Skrip jemputan sahaja
Hanya pengguna disahkan oleh penulis boleh mengakses skrip ini. Anda perlu memohon dan mendapatkan kebenaran untuk menggunakannya. Keizinan selalunya diberikan selepas pembayaran. Untuk lebih butiran, ikuti arahan penulis di bawah atau hubungi GhostVision secara terus.
TradingView TIDAK menyarankan pembayaran atau penggunaan skrip kecuali anda mempercayai sepenuhnya penulis dan memahami bagaimana ia berfungsi. Anda juga boleh menjumpai alternatif sumber terbuka dan percuma yang lain di dalam skrip komuniti kami.