PROTECTED SOURCE SCRIPT
IKODO Harmonic Patterns
IKODO Harmonic Patterns How its Works
IKODO Harmonic Patterns automatically scans your chart to detect Gartley , Bat , Butterfly , and Crab harmonic patterns in real-time, using strict Fibonacci ratio checks with configurable tolerance and pivot lengths.
Pivot Detection
Uses pivot highs/lows with a configurable length to mark potential turning points on the chart.
Stores and updates the last 50 pivots for performance.
Pattern Identification
Continuously checks for XABCD structures:
Confirms alternating pivot highs/lows.
Calculates XA, AB, BC, CD, AD legs.
Validates Fibonacci ratios within your defined tolerance:
Gartley: AB = 0.618 XA, AD = 0.786 XA
Bat: AB = 0.382/0.5 XA, AD = 0.886 XA
Butterfly: AB = 0.786 XA, AD = 1.272/1.618 XA
Crab: AB = 0.382/0.618 XA, AD = 1.618 XA
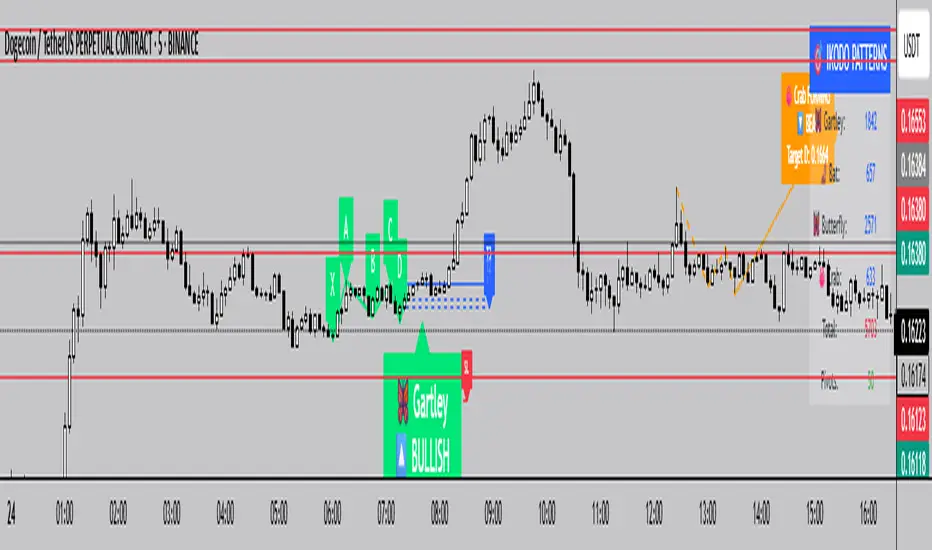
Visualization
Draws XABCD lines and labels on your chart.
Displays entry, three target levels (T1, T2, T3), and a stop-loss suggestion for risk management.
Uses color coding:
Green for bullish patterns.
Red for bearish patterns.
Orange for potential (forming) patterns.
Alerts & Table Stats
Generates alerts when a valid pattern completes.
Displays a live table showing:
Count of each pattern type found.
Total patterns detected.
Number of pivots tracked.
Potential Pattern Projection
If a potential pattern is forming (XAB complete, D pending), the indicator:
Projects the potential D point based on Fibonacci extensions.
Marks the path with dotted/dashed lines.
Displays a label with expected D price and pattern type.
Why Use This?
Automates advanced harmonic detection without manual drawing.
Helps in identifying precise reversal points for high-R/R trades.
Supports visual learning of harmonics while trading.
IKODO Harmonic Patterns automatically scans your chart to detect Gartley , Bat , Butterfly , and Crab harmonic patterns in real-time, using strict Fibonacci ratio checks with configurable tolerance and pivot lengths.
Pivot Detection
Uses pivot highs/lows with a configurable length to mark potential turning points on the chart.
Stores and updates the last 50 pivots for performance.
Pattern Identification
Continuously checks for XABCD structures:
Confirms alternating pivot highs/lows.
Calculates XA, AB, BC, CD, AD legs.
Validates Fibonacci ratios within your defined tolerance:
Gartley: AB = 0.618 XA, AD = 0.786 XA
Bat: AB = 0.382/0.5 XA, AD = 0.886 XA
Butterfly: AB = 0.786 XA, AD = 1.272/1.618 XA
Crab: AB = 0.382/0.618 XA, AD = 1.618 XA
Visualization
Draws XABCD lines and labels on your chart.
Displays entry, three target levels (T1, T2, T3), and a stop-loss suggestion for risk management.
Uses color coding:
Green for bullish patterns.
Red for bearish patterns.
Orange for potential (forming) patterns.
Alerts & Table Stats
Generates alerts when a valid pattern completes.
Displays a live table showing:
Count of each pattern type found.
Total patterns detected.
Number of pivots tracked.
Potential Pattern Projection
If a potential pattern is forming (XAB complete, D pending), the indicator:
Projects the potential D point based on Fibonacci extensions.
Marks the path with dotted/dashed lines.
Displays a label with expected D price and pattern type.
Why Use This?
Automates advanced harmonic detection without manual drawing.
Helps in identifying precise reversal points for high-R/R trades.
Supports visual learning of harmonics while trading.
Skrip dilindungi
Skrip ini diterbitkan sebagai sumber tertutup. Akan tetapi, anda boleh menggunakannya secara bebas dan tanpa apa-apa had – ketahui lebih di sini.
Penafian
Maklumat dan penerbitan adalah tidak bertujuan, dan tidak membentuk, nasihat atau cadangan kewangan, pelaburan, dagangan atau jenis lain yang diberikan atau disahkan oleh TradingView. Baca lebih dalam Terma Penggunaan.