PROTECTED SOURCE SCRIPT
52SIGNAL RECIPE AMA Momentum Vector
═══52SIGNAL RECIPE AMA Momentum Vector═══
◆ Overview
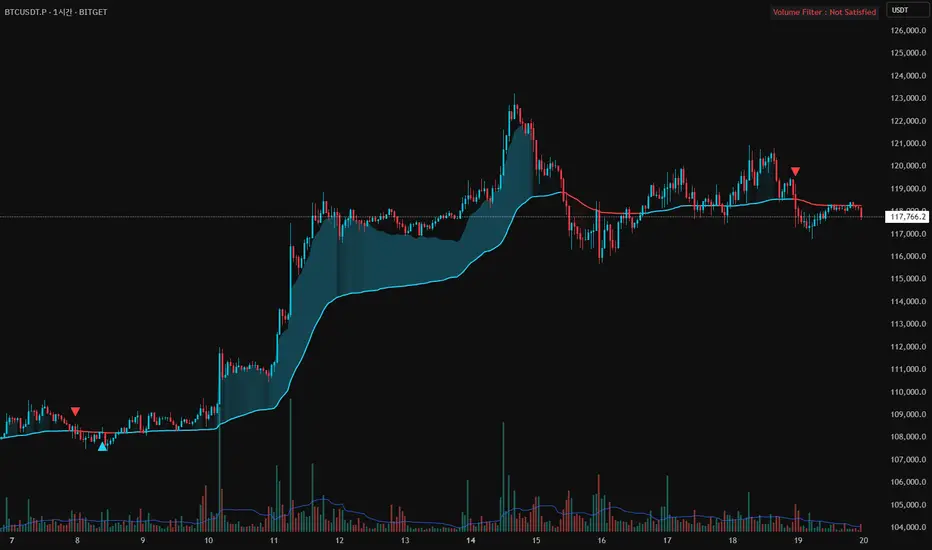
52SIGNAL RECIPE AMA Momentum Vector is an advanced technical indicator based on Adaptive Moving Average (AMA), integrating volume filtering and gradient zone visualization to provide comprehensive analysis of price trends and momentum.
It automatically adjusts to market conditions by calculating efficiency ratios, reducing noise while clearly capturing significant trends. The volume confirmation system helps traders identify high-probability entry and exit points with precision.
─────────────────────────────────────
◆ Key Features
• Adaptive Moving Average: Smart moving average that automatically adjusts based on market conditions
• Volume Filter Integration: Double-confirmation of important price movements through volume analysis
• Momentum Gradient Zones: Intuitive visualization of trend strength through color gradation
• Signal Confirmation System: Generation of high-reliability buy/sell signals by combining multiple factors
• Trend Direction Identification: Clear color distinction between bullish and bearish market conditions
• Automatic Adaptation: Intelligent design that self-adjusts to various market situations
─────────────────────────────────────
◆ Technical Foundation
■ AMA Calculation Principles
• Efficiency Ratio (ER): Measures how efficiently price moves in one direction
• Dynamic Smoothing Coefficient: Automatically adjusts faster or slower based on market conditions
• Adaptive Algorithm: Less sensitive during sideways markets, more responsive during trending markets
• Noise Reduction Function: Filters out meaningless price movements while capturing important signals
■ Momentum Vector Implementation
• Trend-Price Distance Calculation: Measures trend strength by the distance between AMA and current price
• Color Gradation: Visual system where color intensity changes proportionally to trend strength
• ATR-Based Adjustment: Automatically adjusts gradient zone width according to market volatility
• Directional Color Distinction: Intuitive display with blue/cyan for uptrends and red for downtrends
─────────────────────────────────────
◆ Practical Applications
■ Price Trend Interpretation
• Trend Direction Assessment:
▶ Price above AMA with blue gradation indicates ongoing bullish momentum
▶ Price below AMA with red gradation indicates ongoing bearish momentum
• Momentum Strength Verification:
▶ Deeper gradient colors mean stronger momentum and healthier trends
▶ Lighter gradient colors suggest weakening momentum and potential reversal
■ Trading Strategy Utilization
• Trend Following Strategy:
▶ Buy signal when price crosses above AMA with increased volume
▶ Sell signal when price crosses below AMA with increased volume
• Momentum Confirmation Trading:
▶ Deep gradation increases confidence in trend continuation for entry decisions
▶ Multiple consecutive candles staying on one side of AMA increases trend reliability
─────────────────────────────────────
◆ Advanced Configuration Options
■ Input Parameter Guide
• Fast Period (Default: 2)
▶ 1-2: Responds very quickly to price changes. Suitable for short-term trading.
▶ 3-5: Moderate response that reduces frequent signals.
▶ 6-10: Slower response but captures only more definitive trends.
• Slow Period (Default: 30)
▶ 20-25: AMA moves faster. Good for shorter timeframe trading.
▶ 26-35: Balanced speed suitable for most market conditions.
▶ 36-50: AMA moves slowly, smoothly following long-term trends.
• Efficiency Ratio Period (Default: 10)
▶ 5-8: Focuses more on recent price movements. Responds quickly to changes.
▶ 9-12: Balanced period suitable for most situations.
▶ 13-20: Considers longer-term price movements, ignoring temporary fluctuations.
• Volume Average Period (Default: 20)
▶ 10-15: Compares with the average volume of the last 10-15 days. More sensitive to changes.
▶ 16-25: Compares with the average volume of approximately the last month. Balanced setting.
▶ 26-50: Compares with long-term average volume, capturing only truly significant volume changes.
• Volume Threshold Multiplier (Default: 1.2)
▶ 1.0-1.1: Recognizes volume just 10% above average as valid.
▶ 1.2-1.5: Requires volume 20-50% higher than average (e.g., 1.2 means 120% of average).
▶ 1.6-2.0: Recognizes only very high volume at least 1.6 times (160%) above average.
■ Timeframe-Specific Recommended Settings
• Short Timeframes (5min-1hr):
Fast Period 2, Slow Period 20, Efficiency Ratio Period 8
→ Responds quickly to price changes, suitable for day trading.
• Medium Timeframes (4hr-daily):
Fast Period 2, Slow Period 30, Efficiency Ratio Period 10
→ Most balanced setting for general swing trading.
• Long Timeframes (daily-weekly):
Fast Period 2, Slow Period 40, Efficiency Ratio Period 14
→ Optimized for smoothly tracking longer trends.
■ Market-Specific Recommended Settings
• Stock Market:
Volume Threshold 1.2, Volume Average Period 20
→ Signal is valid when volume is 20% above average.
• Forex Market:
Volume Threshold 1.5, Efficiency Ratio Period 12
→ Forex requires higher volume to be meaningful and slightly longer efficiency measurement.
• Cryptocurrency Market:
Volume Threshold 1.3, Fast Period 2, Slow Period 25
→ Settings optimized for highly volatile cryptocurrencies.
─────────────────────────────────────
◆ Synergy with Other Indicators
• Moving Averages: Trend reliability increases when AMA and key moving averages point in the same direction
• RSI/Stochastic: Powerful reversal signals when AMA crossovers occur in overbought/oversold zones
• MACD: Signal probability greatly increases when MACD histogram direction changes coincide with AMA crossovers
• Bollinger Bands: Trend strength can be determined by AMA's position within Bollinger Bands
• Support/Resistance Levels: Success probability dramatically increases when AMA breakouts occur at key price levels
─────────────────────────────────────
◆ Conclusion
AMA Momentum Vector provides accurate price trend analysis by combining the advanced features of adaptive moving averages with momentum visualization technology.
It perfectly adapts to constantly changing market environments through its self-adjusting algorithm and generates highly reliable trading signals through its volume confirmation system.
Users can optimize the indicator for their trading style and market conditions with simple parameter adjustments, enabling effective trading decisions that comprehensively consider price direction, momentum strength, and volume confirmation.
─────────────────────────────────────
※ Disclaimer: Past performance does not guarantee future results. Always use appropriate risk management strategies.
═══52SIGNAL RECIPE AMA Momentum Vector═══
◆ 개요
52SIGNAL RECIPE AMA Momentum Vector는 적응형 이동평균(AMA)을 기반으로 한 고급 기술적 지표로, 볼륨 필터링과 그라데이션 존 시각화를 통합하여 가격 추세와 모멘텀을 종합적으로 분석합니다.
시장 효율성 비율을 자동으로 계산하여 시장 상황에 맞게 스스로 조정되며, 노이즈는 줄이고 중요한 추세는 선명하게 포착합니다. 또한 볼륨 확인 시스템을 통해 높은 확률의 매매 시점을 정확하게 식별할 수 있도록 도와줍니다.
─────────────────────────────────────
◆ 주요 특징
• 적응형 이동평균: 시장 상황에 따라 자동으로 조정되는 스마트한 이동평균선
• 볼륨 필터 통합: 중요한 가격 움직임을 볼륨으로 한번 더 확인
• 모멘텀 그라데이션 존: 색상 그라데이션으로 추세의 강도를 직관적으로 시각화
• 신호 확인 시스템: 여러 요소를 종합하여 신뢰도 높은 매수/매도 신호 생성
• 추세 방향 식별: 상승세와 하락세를 색상으로 명확하게 구분
• 자동 적응 기능: 다양한 시장 상황에 알아서 맞춰지는 지능형 설계
─────────────────────────────────────
◆ 기술적 기반
■ AMA 계산 원리
• 효율성 비율 (ER): 가격이 얼마나 효율적으로 한 방향으로 움직이는지 측정
• 동적 평활화 계수: 시장 상황에 따라 빠르거나 느리게 자동 조절되는 계수
• 적응형 알고리즘: 횡보장에서는 둔감하게, 추세장에서는 민감하게 반응
• 노이즈 감소 기능: 무의미한 가격 움직임은 걸러내고 중요한 신호만 포착
■ 모멘텀 벡터 구현
• 추세-가격 거리 계산: AMA와 현재 가격 사이의 거리로 추세 강도 측정
• 색상 그라데이션: 추세 강도에 비례하여 색상 농도가 변하는 시각화 시스템
• ATR 기반 조정: 시장 변동성에 맞춰 그라데이션 영역 너비 자동 조절
• 방향성 색상 구분: 상승세는 파란색/청록색, 하락세는 빨간색으로 직관적 표시
─────────────────────────────────────
◆ 실용적 응용
■ 가격 추세 해석
• 추세 방향 판단:
▶ 가격이 AMA 위에 있고 파란색 그라데이션이 보이면 상승 모멘텀 진행 중
▶ 가격이 AMA 아래에 있고 빨간색 그라데이션이 보이면 하락 모멘텀 진행 중
• 모멘텀 강도 확인:
▶ 그라데이션 색상이 진할수록 모멘텀이 강하고 추세가 건강함을 의미
▶ 그라데이션 색상이 옅을수록 모멘텀이 약해지고 있으며 반전 가능성 시사
■ 트레이딩 전략 활용
• 추세 추종 전략:
▶ 가격이 AMA를 상향 돌파하고 볼륨이 증가하면 매수 신호
▶ 가격이 AMA를 하향 돌파하고 볼륨이 증가하면 매도 신호
• 모멘텀 확인 트레이딩:
▶ 진한 그라데이션은 추세 지속 가능성이 높음을 의미하므로 진입 확신 강화
▶ 여러 캔들이 연속해서 AMA 한쪽에 머물면 추세의 신뢰도가 높아짐
─────────────────────────────────────
◆ 고급 설정 옵션
■ 인풋 파라미터 가이드
• 빠른 기간 (Fast Period) (기본값: 2)
▶ 1-2: 가격 변화에 매우 빠르게 반응합니다. 단기 거래에 적합합니다.
▶ 3-5: 적당히 반응하여 잦은 신호를 줄여줍니다.
▶ 6-10: 반응이 느리지만 더 확실한 추세만 포착합니다.
• 느린 기간 (Slow Period) (기본값: 30)
▶ 20-25: AMA가 더 빠르게 움직입니다. 짧은 시간 거래에 좋습니다.
▶ 26-35: 균형 잡힌 속도로 대부분의 시장 상황에 적합합니다.
▶ 36-50: AMA가 천천히 움직여 장기 추세를 부드럽게 따라갑니다.
• 효율성 비율 기간 (Efficiency Ratio Period) (기본값: 10)
▶ 5-8: 최근 가격 움직임에 더 집중합니다. 변화에 빠르게 반응합니다.
▶ 9-12: 균형 잡힌 기간으로 대부분의 상황에 적합합니다.
▶ 13-20: 더 긴 기간의 가격 움직임을 고려하여 일시적인 변동을 무시합니다.
• 볼륨 평균 기간 (Volume Average Period) (기본값: 20)
▶ 10-15: 최근 10-15일의 평균 볼륨과 비교합니다. 변화에 민감합니다.
▶ 16-25: 지난 약 한 달간의 평균 볼륨과 비교합니다. 균형 잡힌 설정입니다.
▶ 26-50: 장기 평균 볼륨과 비교하여 정말 큰 볼륨 변화만 포착합니다.
• 볼륨 임계값 승수 (Volume Threshold Multiplier) (기본값: 1.2)
▶ 1.0-1.1: 평균보다 약 10% 정도만 높아도 유효한 볼륨으로 인정합니다.
▶ 1.2-1.5: 평균보다 20~50% 높은 볼륨을 요구합니다(예: 1.2는 평균의 120%).
▶ 1.6-2.0: 평균의 최소 1.6배(160%) 이상 되는 매우 높은 볼륨만 인정합니다.
■ 타임프레임별 추천 설정
• 짧은 시간 차트 (5분-1시간):
빠른 기간 2, 느린 기간 20, 효율성 비율 기간 8
→ 가격 변화에 빠르게 반응하며 단타에 적합합니다.
• 중기 차트 (4시간-일봉):
빠른 기간 2, 느린 기간 30, 효율성 비율 기간 10
→ 일반적인 스윙 트레이딩에 가장 균형 잡힌 설정입니다.
• 장기 차트 (일봉-주봉):
빠른 기간 2, 느린 기간 40, 효율성 비율 기간 14
→ 더 긴 추세를 매끄럽게 추적하는 데 최적화되었습니다.
■ 시장별 추천 설정
• 주식 시장:
볼륨 임계값 1.2, 볼륨 평균 기간 20
→ 평균보다 20% 많은 볼륨이 있을 때 신호가 유효합니다.
• 외환 시장:
볼륨 임계값 1.5, 효율성 비율 기간 12
→ 외환은 볼륨이 더 높아야 의미가 있으며, 약간 더 긴 효율성 측정이 필요합니다.
• 암호화폐 시장:
볼륨 임계값 1.3, 빠른 기간 2, 느린 기간 25
→ 변동성이 큰 암호화폐에 최적화된 설정입니다.
─────────────────────────────────────
◆ 다른 지표와의 시너지
• 이동평균선: AMA와 주요 이동평균선이 같은 방향을 가리킬 때 추세 신뢰도 상승
• RSI/스토캐스틱: 과매수/과매도 구간에서 AMA 교차 발생 시 강력한 반전 신호
• MACD: MACD 히스토그램 방향 변화와 AMA 교차가 일치하면 신호 확률 대폭 증가
• 볼린저 밴드: AMA가 볼린저 밴드 내에서 어떤 위치에 있는지로 추세 강도 판단
• 지지/저항 레벨: 중요 가격대에서 AMA 돌파 시 성공 확률이 크게 증가
─────────────────────────────────────
◆ 결론
AMA Momentum Vector는 적응형 이동평균의 고급 기능과 모멘텀 시각화 기술을 결합하여 정확한 가격 추세 분석을 제공합니다.
자체 조정 알고리즘으로 시시각각 변하는 시장 환경에 완벽하게 적응하며, 볼륨 확인 시스템을 통해 신뢰도 높은 매매 신호를 생성합니다.
사용자는 간단한 파라미터 조정으로 자신의 거래 스타일과 시장 상황에 맞게 지표를 최적화할 수 있어, 가격 방향, 모멘텀 강도, 볼륨 확인을 종합적으로 고려한 효과적인 거래 결정을 내릴 수 있습니다.
─────────────────────────────────────
※ 면책 조항: 과거 성과가 미래 결과를 보장하지 않습니다. 항상 적절한 리스크 관리 전략을 사용하세요.
◆ Overview
52SIGNAL RECIPE AMA Momentum Vector is an advanced technical indicator based on Adaptive Moving Average (AMA), integrating volume filtering and gradient zone visualization to provide comprehensive analysis of price trends and momentum.
It automatically adjusts to market conditions by calculating efficiency ratios, reducing noise while clearly capturing significant trends. The volume confirmation system helps traders identify high-probability entry and exit points with precision.
─────────────────────────────────────
◆ Key Features
• Adaptive Moving Average: Smart moving average that automatically adjusts based on market conditions
• Volume Filter Integration: Double-confirmation of important price movements through volume analysis
• Momentum Gradient Zones: Intuitive visualization of trend strength through color gradation
• Signal Confirmation System: Generation of high-reliability buy/sell signals by combining multiple factors
• Trend Direction Identification: Clear color distinction between bullish and bearish market conditions
• Automatic Adaptation: Intelligent design that self-adjusts to various market situations
─────────────────────────────────────
◆ Technical Foundation
■ AMA Calculation Principles
• Efficiency Ratio (ER): Measures how efficiently price moves in one direction
• Dynamic Smoothing Coefficient: Automatically adjusts faster or slower based on market conditions
• Adaptive Algorithm: Less sensitive during sideways markets, more responsive during trending markets
• Noise Reduction Function: Filters out meaningless price movements while capturing important signals
■ Momentum Vector Implementation
• Trend-Price Distance Calculation: Measures trend strength by the distance between AMA and current price
• Color Gradation: Visual system where color intensity changes proportionally to trend strength
• ATR-Based Adjustment: Automatically adjusts gradient zone width according to market volatility
• Directional Color Distinction: Intuitive display with blue/cyan for uptrends and red for downtrends
─────────────────────────────────────
◆ Practical Applications
■ Price Trend Interpretation
• Trend Direction Assessment:
▶ Price above AMA with blue gradation indicates ongoing bullish momentum
▶ Price below AMA with red gradation indicates ongoing bearish momentum
• Momentum Strength Verification:
▶ Deeper gradient colors mean stronger momentum and healthier trends
▶ Lighter gradient colors suggest weakening momentum and potential reversal
■ Trading Strategy Utilization
• Trend Following Strategy:
▶ Buy signal when price crosses above AMA with increased volume
▶ Sell signal when price crosses below AMA with increased volume
• Momentum Confirmation Trading:
▶ Deep gradation increases confidence in trend continuation for entry decisions
▶ Multiple consecutive candles staying on one side of AMA increases trend reliability
─────────────────────────────────────
◆ Advanced Configuration Options
■ Input Parameter Guide
• Fast Period (Default: 2)
▶ 1-2: Responds very quickly to price changes. Suitable for short-term trading.
▶ 3-5: Moderate response that reduces frequent signals.
▶ 6-10: Slower response but captures only more definitive trends.
• Slow Period (Default: 30)
▶ 20-25: AMA moves faster. Good for shorter timeframe trading.
▶ 26-35: Balanced speed suitable for most market conditions.
▶ 36-50: AMA moves slowly, smoothly following long-term trends.
• Efficiency Ratio Period (Default: 10)
▶ 5-8: Focuses more on recent price movements. Responds quickly to changes.
▶ 9-12: Balanced period suitable for most situations.
▶ 13-20: Considers longer-term price movements, ignoring temporary fluctuations.
• Volume Average Period (Default: 20)
▶ 10-15: Compares with the average volume of the last 10-15 days. More sensitive to changes.
▶ 16-25: Compares with the average volume of approximately the last month. Balanced setting.
▶ 26-50: Compares with long-term average volume, capturing only truly significant volume changes.
• Volume Threshold Multiplier (Default: 1.2)
▶ 1.0-1.1: Recognizes volume just 10% above average as valid.
▶ 1.2-1.5: Requires volume 20-50% higher than average (e.g., 1.2 means 120% of average).
▶ 1.6-2.0: Recognizes only very high volume at least 1.6 times (160%) above average.
■ Timeframe-Specific Recommended Settings
• Short Timeframes (5min-1hr):
Fast Period 2, Slow Period 20, Efficiency Ratio Period 8
→ Responds quickly to price changes, suitable for day trading.
• Medium Timeframes (4hr-daily):
Fast Period 2, Slow Period 30, Efficiency Ratio Period 10
→ Most balanced setting for general swing trading.
• Long Timeframes (daily-weekly):
Fast Period 2, Slow Period 40, Efficiency Ratio Period 14
→ Optimized for smoothly tracking longer trends.
■ Market-Specific Recommended Settings
• Stock Market:
Volume Threshold 1.2, Volume Average Period 20
→ Signal is valid when volume is 20% above average.
• Forex Market:
Volume Threshold 1.5, Efficiency Ratio Period 12
→ Forex requires higher volume to be meaningful and slightly longer efficiency measurement.
• Cryptocurrency Market:
Volume Threshold 1.3, Fast Period 2, Slow Period 25
→ Settings optimized for highly volatile cryptocurrencies.
─────────────────────────────────────
◆ Synergy with Other Indicators
• Moving Averages: Trend reliability increases when AMA and key moving averages point in the same direction
• RSI/Stochastic: Powerful reversal signals when AMA crossovers occur in overbought/oversold zones
• MACD: Signal probability greatly increases when MACD histogram direction changes coincide with AMA crossovers
• Bollinger Bands: Trend strength can be determined by AMA's position within Bollinger Bands
• Support/Resistance Levels: Success probability dramatically increases when AMA breakouts occur at key price levels
─────────────────────────────────────
◆ Conclusion
AMA Momentum Vector provides accurate price trend analysis by combining the advanced features of adaptive moving averages with momentum visualization technology.
It perfectly adapts to constantly changing market environments through its self-adjusting algorithm and generates highly reliable trading signals through its volume confirmation system.
Users can optimize the indicator for their trading style and market conditions with simple parameter adjustments, enabling effective trading decisions that comprehensively consider price direction, momentum strength, and volume confirmation.
─────────────────────────────────────
※ Disclaimer: Past performance does not guarantee future results. Always use appropriate risk management strategies.
═══52SIGNAL RECIPE AMA Momentum Vector═══
◆ 개요
52SIGNAL RECIPE AMA Momentum Vector는 적응형 이동평균(AMA)을 기반으로 한 고급 기술적 지표로, 볼륨 필터링과 그라데이션 존 시각화를 통합하여 가격 추세와 모멘텀을 종합적으로 분석합니다.
시장 효율성 비율을 자동으로 계산하여 시장 상황에 맞게 스스로 조정되며, 노이즈는 줄이고 중요한 추세는 선명하게 포착합니다. 또한 볼륨 확인 시스템을 통해 높은 확률의 매매 시점을 정확하게 식별할 수 있도록 도와줍니다.
─────────────────────────────────────
◆ 주요 특징
• 적응형 이동평균: 시장 상황에 따라 자동으로 조정되는 스마트한 이동평균선
• 볼륨 필터 통합: 중요한 가격 움직임을 볼륨으로 한번 더 확인
• 모멘텀 그라데이션 존: 색상 그라데이션으로 추세의 강도를 직관적으로 시각화
• 신호 확인 시스템: 여러 요소를 종합하여 신뢰도 높은 매수/매도 신호 생성
• 추세 방향 식별: 상승세와 하락세를 색상으로 명확하게 구분
• 자동 적응 기능: 다양한 시장 상황에 알아서 맞춰지는 지능형 설계
─────────────────────────────────────
◆ 기술적 기반
■ AMA 계산 원리
• 효율성 비율 (ER): 가격이 얼마나 효율적으로 한 방향으로 움직이는지 측정
• 동적 평활화 계수: 시장 상황에 따라 빠르거나 느리게 자동 조절되는 계수
• 적응형 알고리즘: 횡보장에서는 둔감하게, 추세장에서는 민감하게 반응
• 노이즈 감소 기능: 무의미한 가격 움직임은 걸러내고 중요한 신호만 포착
■ 모멘텀 벡터 구현
• 추세-가격 거리 계산: AMA와 현재 가격 사이의 거리로 추세 강도 측정
• 색상 그라데이션: 추세 강도에 비례하여 색상 농도가 변하는 시각화 시스템
• ATR 기반 조정: 시장 변동성에 맞춰 그라데이션 영역 너비 자동 조절
• 방향성 색상 구분: 상승세는 파란색/청록색, 하락세는 빨간색으로 직관적 표시
─────────────────────────────────────
◆ 실용적 응용
■ 가격 추세 해석
• 추세 방향 판단:
▶ 가격이 AMA 위에 있고 파란색 그라데이션이 보이면 상승 모멘텀 진행 중
▶ 가격이 AMA 아래에 있고 빨간색 그라데이션이 보이면 하락 모멘텀 진행 중
• 모멘텀 강도 확인:
▶ 그라데이션 색상이 진할수록 모멘텀이 강하고 추세가 건강함을 의미
▶ 그라데이션 색상이 옅을수록 모멘텀이 약해지고 있으며 반전 가능성 시사
■ 트레이딩 전략 활용
• 추세 추종 전략:
▶ 가격이 AMA를 상향 돌파하고 볼륨이 증가하면 매수 신호
▶ 가격이 AMA를 하향 돌파하고 볼륨이 증가하면 매도 신호
• 모멘텀 확인 트레이딩:
▶ 진한 그라데이션은 추세 지속 가능성이 높음을 의미하므로 진입 확신 강화
▶ 여러 캔들이 연속해서 AMA 한쪽에 머물면 추세의 신뢰도가 높아짐
─────────────────────────────────────
◆ 고급 설정 옵션
■ 인풋 파라미터 가이드
• 빠른 기간 (Fast Period) (기본값: 2)
▶ 1-2: 가격 변화에 매우 빠르게 반응합니다. 단기 거래에 적합합니다.
▶ 3-5: 적당히 반응하여 잦은 신호를 줄여줍니다.
▶ 6-10: 반응이 느리지만 더 확실한 추세만 포착합니다.
• 느린 기간 (Slow Period) (기본값: 30)
▶ 20-25: AMA가 더 빠르게 움직입니다. 짧은 시간 거래에 좋습니다.
▶ 26-35: 균형 잡힌 속도로 대부분의 시장 상황에 적합합니다.
▶ 36-50: AMA가 천천히 움직여 장기 추세를 부드럽게 따라갑니다.
• 효율성 비율 기간 (Efficiency Ratio Period) (기본값: 10)
▶ 5-8: 최근 가격 움직임에 더 집중합니다. 변화에 빠르게 반응합니다.
▶ 9-12: 균형 잡힌 기간으로 대부분의 상황에 적합합니다.
▶ 13-20: 더 긴 기간의 가격 움직임을 고려하여 일시적인 변동을 무시합니다.
• 볼륨 평균 기간 (Volume Average Period) (기본값: 20)
▶ 10-15: 최근 10-15일의 평균 볼륨과 비교합니다. 변화에 민감합니다.
▶ 16-25: 지난 약 한 달간의 평균 볼륨과 비교합니다. 균형 잡힌 설정입니다.
▶ 26-50: 장기 평균 볼륨과 비교하여 정말 큰 볼륨 변화만 포착합니다.
• 볼륨 임계값 승수 (Volume Threshold Multiplier) (기본값: 1.2)
▶ 1.0-1.1: 평균보다 약 10% 정도만 높아도 유효한 볼륨으로 인정합니다.
▶ 1.2-1.5: 평균보다 20~50% 높은 볼륨을 요구합니다(예: 1.2는 평균의 120%).
▶ 1.6-2.0: 평균의 최소 1.6배(160%) 이상 되는 매우 높은 볼륨만 인정합니다.
■ 타임프레임별 추천 설정
• 짧은 시간 차트 (5분-1시간):
빠른 기간 2, 느린 기간 20, 효율성 비율 기간 8
→ 가격 변화에 빠르게 반응하며 단타에 적합합니다.
• 중기 차트 (4시간-일봉):
빠른 기간 2, 느린 기간 30, 효율성 비율 기간 10
→ 일반적인 스윙 트레이딩에 가장 균형 잡힌 설정입니다.
• 장기 차트 (일봉-주봉):
빠른 기간 2, 느린 기간 40, 효율성 비율 기간 14
→ 더 긴 추세를 매끄럽게 추적하는 데 최적화되었습니다.
■ 시장별 추천 설정
• 주식 시장:
볼륨 임계값 1.2, 볼륨 평균 기간 20
→ 평균보다 20% 많은 볼륨이 있을 때 신호가 유효합니다.
• 외환 시장:
볼륨 임계값 1.5, 효율성 비율 기간 12
→ 외환은 볼륨이 더 높아야 의미가 있으며, 약간 더 긴 효율성 측정이 필요합니다.
• 암호화폐 시장:
볼륨 임계값 1.3, 빠른 기간 2, 느린 기간 25
→ 변동성이 큰 암호화폐에 최적화된 설정입니다.
─────────────────────────────────────
◆ 다른 지표와의 시너지
• 이동평균선: AMA와 주요 이동평균선이 같은 방향을 가리킬 때 추세 신뢰도 상승
• RSI/스토캐스틱: 과매수/과매도 구간에서 AMA 교차 발생 시 강력한 반전 신호
• MACD: MACD 히스토그램 방향 변화와 AMA 교차가 일치하면 신호 확률 대폭 증가
• 볼린저 밴드: AMA가 볼린저 밴드 내에서 어떤 위치에 있는지로 추세 강도 판단
• 지지/저항 레벨: 중요 가격대에서 AMA 돌파 시 성공 확률이 크게 증가
─────────────────────────────────────
◆ 결론
AMA Momentum Vector는 적응형 이동평균의 고급 기능과 모멘텀 시각화 기술을 결합하여 정확한 가격 추세 분석을 제공합니다.
자체 조정 알고리즘으로 시시각각 변하는 시장 환경에 완벽하게 적응하며, 볼륨 확인 시스템을 통해 신뢰도 높은 매매 신호를 생성합니다.
사용자는 간단한 파라미터 조정으로 자신의 거래 스타일과 시장 상황에 맞게 지표를 최적화할 수 있어, 가격 방향, 모멘텀 강도, 볼륨 확인을 종합적으로 고려한 효과적인 거래 결정을 내릴 수 있습니다.
─────────────────────────────────────
※ 면책 조항: 과거 성과가 미래 결과를 보장하지 않습니다. 항상 적절한 리스크 관리 전략을 사용하세요.
Skrip dilindungi
Skrip ini diterbitkan sebagai sumber tertutup. Akan tetapi, anda boleh menggunakannya secara bebas dan tanpa apa-apa had – ketahui lebih di sini.
Recipe your trading with 52SIGNAL.
No more repainting tricks, fake backtesting data, or unrealistic returns.
No more repainting tricks, fake backtesting data, or unrealistic returns.
Penafian
Maklumat dan penerbitan adalah tidak bertujuan, dan tidak membentuk, nasihat atau cadangan kewangan, pelaburan, dagangan atau jenis lain yang diberikan atau disahkan oleh TradingView. Baca lebih dalam Terma Penggunaan.