OPEN-SOURCE SCRIPT
RSI_Heikinashi
📜 Title:
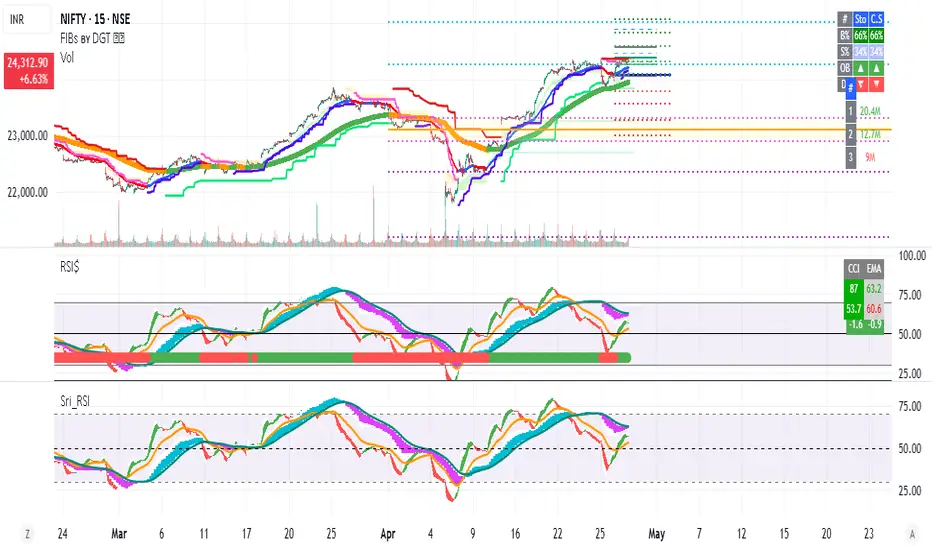
Heikin-Ashi RSI Candle Plot with Multi-Timeframe Analysis and EMA Overlay
📖 Full Description:
This is an original custom indicator that transforms the traditional Relative Strength Index (RSI) into a Heikin-Ashi (HA) candle representation, allowing traders to visualize RSI trends with greater clarity, less noise, and multi-timeframe perspective.
🛠️ Core Concept and Original Method:
Rather than plotting a single RSI line, this script recalculates RSI into a Heikin-Ashi candle format, using a double EMA smoothing method on the RSI data itself.
Here's how the transformation works:
RSI Calculation:
RSI is computed traditionally using Wilder's Moving Average (RMA) for smoothing gains and losses.
The RSI period and price source are fully customizable (default length = 28, source = close).
Heikin-Ashi Style Smoothing (applied to RSI):
The HA Close is calculated as the EMA of the average between the current RSI and previous HA Close.
The HA Open is calculated as the EMA of the average between the previous HA Open and the current HA Close.
The HA High and HA Low are dynamically calculated based on the maximum/minimum values of the current RSI, HA Open, and HA Close.
Smoothing is done via 5-period EMA, which adds a unique layer of trend smoothing without traditional price-based HA calculation.
Multi-Timeframe Comparison:
In addition to plotting the chart timeframe HA RSI, the indicator retrieves the 1-hour timeframe HA RSI using request.security.
This allows traders to align trades with higher timeframe RSI trends, a powerful technique for multi-timeframe confirmation.
50 EMA Overlay:
A 50-period Exponential Moving Average (EMA) is plotted over both the chart timeframe HA RSI and the 1-hour HA RSI.
EMA acts as a trend filter or dynamic support/resistance for RSI behavior.
RSI Bands and Visual Aids:
Standard RSI bands at 70 (Overbought), 50 (Midline), and 30 (Oversold) are plotted.
A shaded background between the 30–70 levels helps highlight RSI range-bound movements versus breakout momentum.
🔥 Why this script is original and useful:
Unique Application:
This is not a simple RSI plot or standard Heikin-Ashi candle — it is a specialized smoothing method applied directly to RSI values for a clearer, noise-reduced momentum reading.
Multi-Timeframe Advantage:
Unlike typical RSI indicators, it includes a 1-hour timeframe comparison alongside the chart timeframe, improving decision-making across intraday and swing strategies.
Advanced Smoothing Logic:
Double EMA smoothing of RSI and HA-style recalculations offer a much smoother signal than traditional RSI or basic RSI/EMA crossovers.
Visualized Trend Strength:
Using colored candles instead of just a line enhances readability and gives an intuitive sense of momentum direction, strength, and possible reversals.
Fully Customizable:
Traders can adjust the RSI period and source depending on asset volatility or timeframe preferences.
📋 How to Use:
Look for HA RSI candles color changes for early momentum shifts.
Use the 50 EMA crossovers on HA RSI to confirm larger trend changes.
Compare chart timeframe vs 1H timeframe HA RSI for stronger signal alignment.
Watch for overbought/oversold breaks beyond the 70/30 bands for trade entries or exits.
⚙️ Inputs:
RSI Length (Default: 28)
RSI Source (Default: Close)
📢 Important Note:
This script is originally conceptualized and custom-built.
It is not a mashup of existing open-source indicators and introduces a new smoothing technique for RSI visualization.
🙏 Credits:
Script developed by Sri_RSI.
Skrip sumber terbuka
Dalam semangat TradingView sebenar, pencipta skrip ini telah menjadikannya sumber terbuka, jadi pedagang boleh menilai dan mengesahkan kefungsiannya. Terima kasih kepada penulis! Walaupuan anda boleh menggunakan secara percuma, ingat bahawa penerbitan semula kod ini tertakluk kepada Peraturan Dalaman.
Penafian
Maklumat dan penerbitan adalah tidak bertujuan, dan tidak membentuk, nasihat atau cadangan kewangan, pelaburan, dagangan atau jenis lain yang diberikan atau disahkan oleh TradingView. Baca lebih dalam Terma Penggunaan.