PROTECTED SOURCE SCRIPT
Telah dikemas kini Sigma-Level

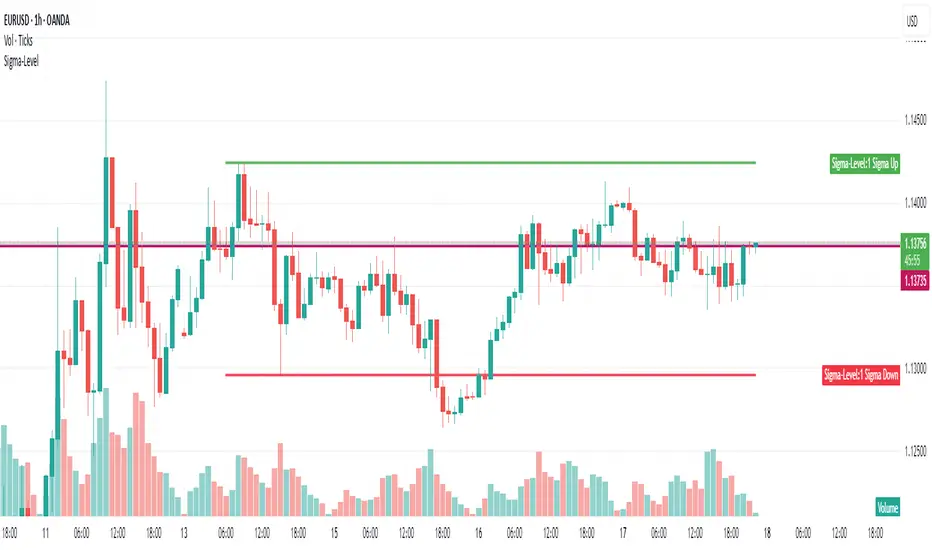
1-Sigma-Level Indicator (for 28 FX Pairs)
This TradingView indicator calculates and visualizes the 1-sigma price projection range for the current FX pair, based on implied volatility (IV) and a user-defined reference price.
🔧 User Inputs
1. Implied Volatility (IV) Selection
You can choose which volatility term to apply:
ON (Overnight)
1W (1 Week)
1M (1 Month)
Each currency pair uses manually entered IV values (in %), grouped by base currency (USD, EUR, GBP, etc.).
https://www.investing.com/currencies/forex-options
2. Base Price Selection
You can define the price level used as the anchor for the sigma projection:
CurrentPrice — live market price
YesterdayClose — close of the previous day
LastHourClose — close of the last 1-hour candle
LastFriday — weekly close from last Friday
LastMonthClose — close of the previous monthly candle
LastYearClose — close of the previous yearly candle
These values are retrieved using the appropriate timeframe (D, W, M, 12M, or 60 for hourly).
📐 How the Calculation Works
The indicator calculates the 1σ range using this formula:
1σ Range = basePrice × (IV / √N) / 100
Where:
basePrice is the selected anchor price.
IV is the selected implied volatility for the current pair.
N is the number of periods per year, depending on the IV term:
√252 for ON (trading days)
√52 for 1W (weeks)
√12 for 1M (months)
The upper and lower bands are then:
1σ Up = basePrice + range
1σ Down = basePrice - range
These bands are plotted only during the current calendar week.
🖼️ Visual Output
Green Line: 1σ Upper Boundary
Red Line: 1σ Lower Boundary
Labels show the exact 1σ values at the most recent bar
⚠️ Disclaimer
This indicator is for informational and analytical purposes only. It does not constitute financial advice, a trading signal, or a guarantee of future performance. Always perform your own research and consult with a qualified financial advisor before making trading decisions.
Nota Keluaran
Updaten Input to ON 1W and 1MNota Keluaran
Fix Price SettingsNota Keluaran
Shrink to only ONSkrip dilindungi
Skrip ini diterbitkan sebagai sumber tertutup. Akan tetapi, anda boleh menggunakannya secara bebas dan tanpa apa-apa had – ketahui lebih di sini.
Penafian
Maklumat dan penerbitan adalah tidak bertujuan, dan tidak membentuk, nasihat atau cadangan kewangan, pelaburan, dagangan atau jenis lain yang diberikan atau disahkan oleh TradingView. Baca lebih dalam Terma Penggunaan.
Skrip dilindungi
Skrip ini diterbitkan sebagai sumber tertutup. Akan tetapi, anda boleh menggunakannya secara bebas dan tanpa apa-apa had – ketahui lebih di sini.
Penafian
Maklumat dan penerbitan adalah tidak bertujuan, dan tidak membentuk, nasihat atau cadangan kewangan, pelaburan, dagangan atau jenis lain yang diberikan atau disahkan oleh TradingView. Baca lebih dalam Terma Penggunaan.