OPEN-SOURCE SCRIPT
Telah dikemas kini Gold Valuation
Gold Value Index
The Gold Value Index (GVI) is a macro-driven oscillator that estimates the relative value of gold based on real-time movements in the US Dollar Index (DXY) and the 10-Year US Treasury Yield (US10Y). It helps traders contextualize gold’s price within broader macroeconomic pressure — identifying when gold may be over- or undervalued relative to these key drivers.
How It Works – Macro Inputs:
DXY (US Dollar Index): Typically moves inversely to gold. A rising dollar suggests downward pressure on gold value.
US10Y Yield: Higher yields increase the opportunity cost of holding gold, often leading to weaker gold prices.
Both inputs are Z-score normalized and inverted to reflect their typical negative correlation with gold. When combined, they form a single, scaled index from 0 (undervalued) to 100 (overvalued).
Why Use This Tool?
Gold reacts to macro forces as much as technical ones. The GVI blends these inputs into a clear, visual gauge to:
Anticipate mean-reversion setups.
Avoid emotionally-driven trades in extreme macro conditions.
Enhance timing by understanding gold's macro context.
Important Notes:
Data sources include ICEUS:DXY and TVC:US10Y via TradingView.
Code is protected — this is a private, invite-only script.
Nota Keluaran
Gold Value Index – Invite-Only ScriptThe Gold Value Index (GVI) is a macro-driven oscillator that estimates the relative value of gold based on real-time movements in the US Dollar Index (DXY) and the 10-Year US Treasury Yield (US10Y). It helps traders contextualize gold’s price within broader macroeconomic pressure — identifying when gold may be over- or undervalued relative to these key drivers.
How It Works – Macro Inputs:
DXY (US Dollar Index): Typically moves inversely to gold. A rising dollar suggests downward pressure on gold value.
US10Y Yield: Higher yields increase the opportunity cost of holding gold, often leading to weaker gold prices.
Both inputs are Z-score normalized and inverted to reflect their typical negative correlation with gold. When combined, they form a single, scaled index from 0 (undervalued) to 100 (overvalued).
Why Use This Tool?
Gold reacts to macro forces as much as technical ones. The GVI blends these inputs into a clear, visual gauge to:
Anticipate mean-reversion setups.
Avoid emotionally-driven trades in extreme macro conditions.
Enhance timing by understanding gold's macro context.
Important Notes:
Data sources include ICEUS:DXY and TVC:US10Y via TradingView.
Code is protected — this is a private, invite-only script.
Nota Keluaran
Gold Value Index (Macro-Weighted Oscillator)The Gold Value Index (GVI) is a macro-informed oscillator that measures gold’s valuation in real-time relative to core macroeconomic forces — the US Dollar Index (DXY) and US 10-Year Treasury Yield (US10Y). The tool is designed to help traders time gold mean-reversion trades, avoid FOMO during extremes, and gain macro context for technical setups.
How It Works – Components:
Z-Score Normalization:
Both DXY and US10Y are normalized using a Z-score formula, measuring how far their current price deviates from the mean in standard deviations. This makes different scales comparable and captures relative strength.
Inverse Correlation with Gold:
Since DXY and US10Y tend to move opposite to gold, their Z-scores are inverted. A rising DXY or yield typically pressures gold down — this relationship is built into the model.
Weighted Average Logic:
You can toggle DXY and/or US10Y individually. The script automatically adjusts weightings based on active components to maintain signal integrity.
Scaled Output:
The combined score is transformed into a 0–100 scale:
0–25 = Undervalued
75–100 = Overvalued
50 = Neutral
⚙️ Unique Enhancements:
✅ Trend Filter using adjustable EMA
✅ Volatility Filter with ATR threshold
✅ Signal Cooldown to reduce noise
✅ Optional macro input toggles
These additions ensure the script gives only high-probability, trend-aligned reversal signals in macro extremes — unlike traditional oscillators that may constantly flip in choppy environments.
🧭 How to Use:
Works well on 1H–4H–Daily timeframes
Combine with price action or other macro indicators
Ideal for swing and position traders looking to align trades with macro pressure
🔍 Data Sources:
ICEUS:DXY for US Dollar Index
TVC:US10Y for Treasury Yield
Nota Keluaran
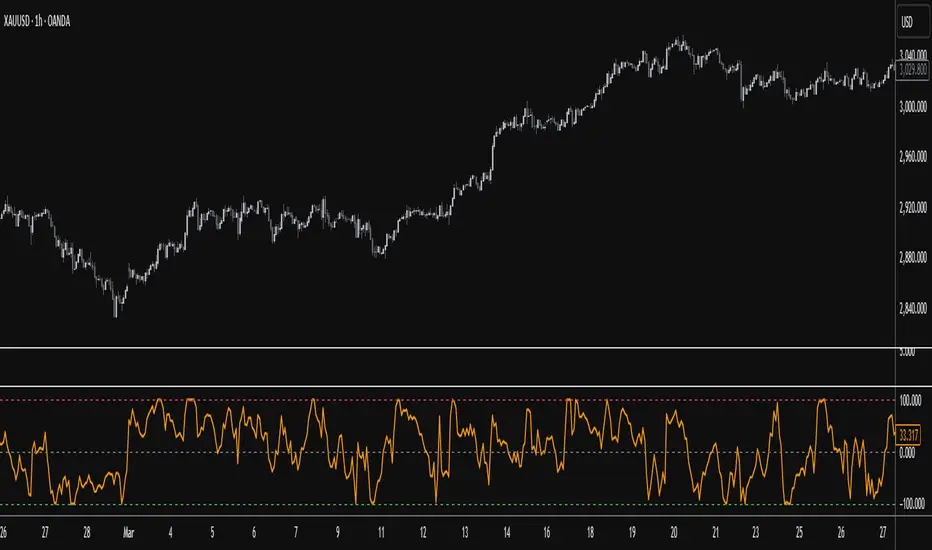
Gold Valuation IndexThe Gold vs Dollar Valuation Index is a custom indicator that evaluates the relative valuation of gold in the context of key macroeconomic forces: the U.S. Dollar (via the DXY Index) and the 10-Year U.S. Treasury Yield (US10Y). Designed for traders, analysts, and investors, this tool helps contextualize gold’s current strength or weakness within the broader economic environment.
🎯 Purpose
This indicator provides a normalized score on a scale from -100 to +100, representing gold's valuation relative to external macro factors:
Positive values (above 0) suggest gold is strong compared to the dollar and/or interest rates — potentially overvalued.
Negative values (below 0) suggest relative weakness — possibly undervalued.
Zero (0) indicates a neutral valuation in macroeconomic terms.
⚙️ How It Works
The indicator uses Z-score normalization to compare:
Gold price (always included),
DXY index (optional),
10-Year Treasury yield (optional).
These values are blended into a composite index, then scaled to a symmetric range of -100 to +100. This gives a clear and intuitive view of how gold performs in relation to macroeconomic pressures.
🔧 User Settings
Users can customize the indicator via:
Z-Score Length: Number of periods for normalization (default: 50).
Include DXY: Toggle to include/exclude the U.S. Dollar Index.
Include 10Y Yield: Toggle to include/exclude interest rate influence.
This flexibility makes the indicator adaptable to various economic conditions and trading strategies.
📊 Visual Representation
The indicator plots a dynamic line on a -100 to +100 scale, with reference levels at:
+100 (Overvalued) — potential caution or profit-taking zone,
0 (Neutral) — balanced macroeconomic valuation,
-100 (Undervalued) — potential buying opportunity.
🧠 Use Cases
Macro context for gold: Understand gold’s position relative to economic drivers.
Timing tool: Enhance decisions on gold-related trades (GLD, GDX, XAU/USD).
Sentiment filter: Identify extreme divergences that may signal opportunity or risk.
📌 Note
This indicator is meant to provide contextual insight, not standalone buy/sell signals. For best results, use it in combination with other tools such as price action, volume, or fundamental analysis.
🔔 Disclaimer: This tool is intended for educational and analytical purposes. Always conduct your own research and risk management before making trading decisions. Past performance does not guarantee future outcomes.
Skrip sumber terbuka
Dalam semangat TradingView sebenar, pencipta skrip ini telah menjadikannya sumber terbuka, jadi pedagang boleh menilai dan mengesahkan kefungsiannya. Terima kasih kepada penulis! Walaupuan anda boleh menggunakan secara percuma, ingat bahawa penerbitan semula kod ini tertakluk kepada Peraturan Dalaman.
Penafian
Maklumat dan penerbitan adalah tidak bertujuan, dan tidak membentuk, nasihat atau cadangan kewangan, pelaburan, dagangan atau jenis lain yang diberikan atau disahkan oleh TradingView. Baca lebih dalam Terma Penggunaan.