PROTECTED SOURCE SCRIPT
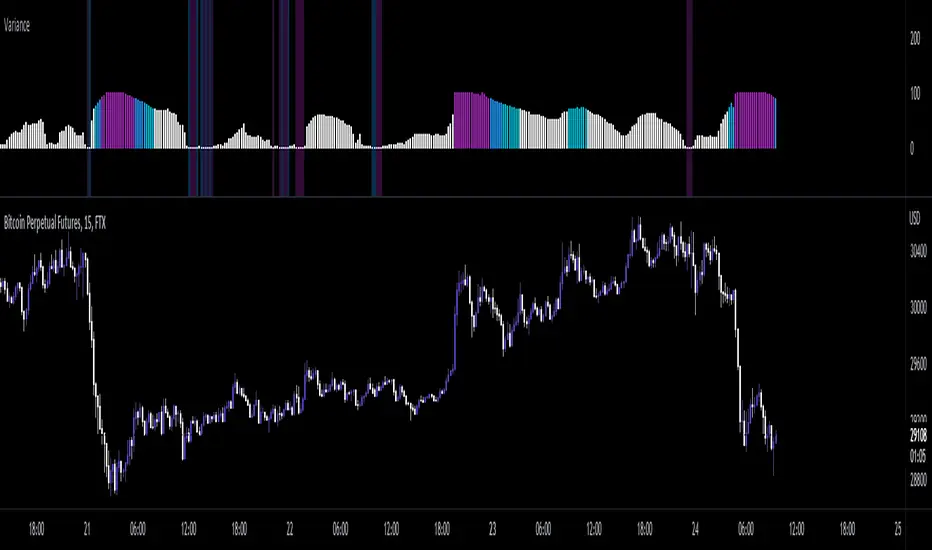
Variance Percentile
As repeated from my Variance Z-Score Script:
"Variance is a measure of dispersion, simply put, it is measuring how distant data is from it's mean(average). This indicator allows you to see when variance is increasing or decreasing, as well as when it is at an extreme value. Thru this, you can get a more accurate description of risk. When variance is increasing/high, you know to expect larger moves, as data(price) is far and getting farther from the mean. and when it is low/decreasing, you know that price movement is more likely to be less volatile due to data clustering closer to the mean, ie ; smaller values."
With Variance Percentile, we apply a percent rank function to get some statistical context from raw variance data. Used the same as my pervious Historical volatility indicator, it shows what % of historical data was less than or equal to the current value, allowing us to find point where variance is statistically likely to increase, as well as when it is at an extreme.
Recommended to paired with Historical volatility or Volatility Z-score to assist in establishing a more accurate estimation of market volatility
Skrip dilindungi
Skrip ini diterbitkan sebagai sumber tertutup. Akan tetapi, anda boleh menggunakannya secara bebas dan tanpa apa-apa had – ketahui lebih di sini.
Penafian
Maklumat dan penerbitan adalah tidak bertujuan, dan tidak membentuk, nasihat atau cadangan kewangan, pelaburan, dagangan atau jenis lain yang diberikan atau disahkan oleh TradingView. Baca lebih dalam Terma Penggunaan.