OPEN-SOURCE SCRIPT
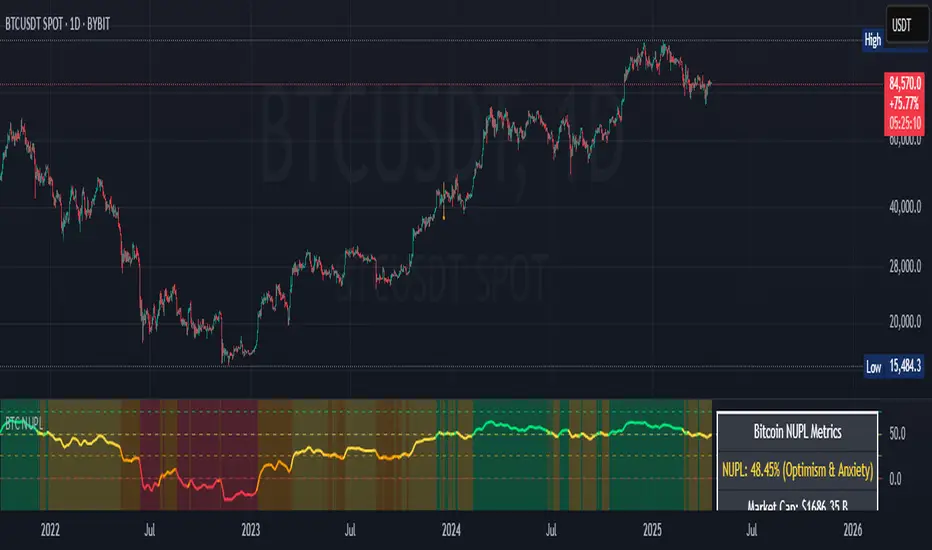
Bitcoin NUPL Indicator

The Bitcoin NUPL (Net Unrealized Profit/Loss) Indicator is a powerful metric that shows the difference between Bitcoin's market cap and realized cap as a percentage of market cap. This indicator helps identify different market cycle phases, from capitulation to euphoria.
// How It Works
NUPL measures the aggregate profit or loss held by Bitcoin investors, calculated as:
```
NUPL = ((Market Cap - Realized Cap) / Market Cap) * 100
```
// Market Cycle Phases
The indicator automatically color-codes different market phases:
• **Deep Red (< 0%)**: Capitulation Phase - Most coins held at a loss, historically excellent buying opportunities
• **Orange (0-25%)**: Hope & Fear Phase - Early accumulation, price uncertainty and consolidation
• **Yellow (25-50%)**: Optimism & Anxiety Phase - Emerging bull market, increasing confidence
• **Light Green (50-75%)**: Belief & Denial Phase - Strong bull market, high conviction
• **Bright Green (> 75%)**: Euphoria & Greed Phase - Potential market top, historically good profit-taking zone
// Features
• Real-time NUPL calculation with customizable smoothing
• RSI indicator for additional momentum confirmation
• Color-coded background reflecting current market phase
• Reference lines marking key transition zones
• Detailed metrics table showing NUPL value, market sentiment, market cap, realized cap, and RSI
// Strategy Applications
• **Long-term investors**: Use extreme negative NUPL values (deep red) to identify potential bottoms for accumulation
• **Swing traders**: Look for transitions between phases for potential trend changes
• **Risk management**: Consider taking profits when entering the "Euphoria & Greed" phase (bright green)
• **Mean reversion**: Watch for overbought/oversold conditions when NUPL reaches historical extremes
// Settings
• **RSI Length**: Adjusts the period for RSI calculation
• **NUPL Smoothing Length**: Applies moving average smoothing to reduce noise
// Notes
• Premium TradingView subscription required for Glassnode and Coin Metrics data
• Best viewed on daily timeframes for macro analysis
• Historical NUPL extremes have often marked cycle bottoms and tops
• Use in conjunction with other indicators for confirmation
Skrip sumber terbuka
Dalam semangat TradingView sebenar, pencipta skrip ini telah menjadikannya sumber terbuka, jadi pedagang boleh menilai dan mengesahkan kefungsiannya. Terima kasih kepada penulis! Walaupuan anda boleh menggunakan secara percuma, ingat bahawa penerbitan semula kod ini tertakluk kepada Peraturan Dalaman.
Penafian
Maklumat dan penerbitan adalah tidak bertujuan, dan tidak membentuk, nasihat atau cadangan kewangan, pelaburan, dagangan atau jenis lain yang diberikan atau disahkan oleh TradingView. Baca lebih dalam Terma Penggunaan.