OPEN-SOURCE SCRIPT
Normalized Volatility
OVERVIEW
The Normalized Volatility indicator is a technical indicator that gauges the amount of volatility currently present in the market, relative to the average volatility in the market. The purpose of this indicator is to filter out with-trend signals during ranging/non-trending/consolidating conditions.
CONCEPTS
This indicator assists traders in capitalizing on the assumption that trends are more likely to start during periods of high volatility compared to periods of low volatility. This is because high volatility indicates that there are bigger players currently in the market, which is necessary to begin a sustained trending move.
So, to determine whether the current volatility is "high", it is compared to an average volatility for however number of candles back the user specifies.
If the current volatility is greater than the average volatility, it is reasonable to assume we are in a high-volatility period. Thus, this is the ideal time to enter a trending trade due to the assumption that trends are more likely to start during these high-volatility periods.
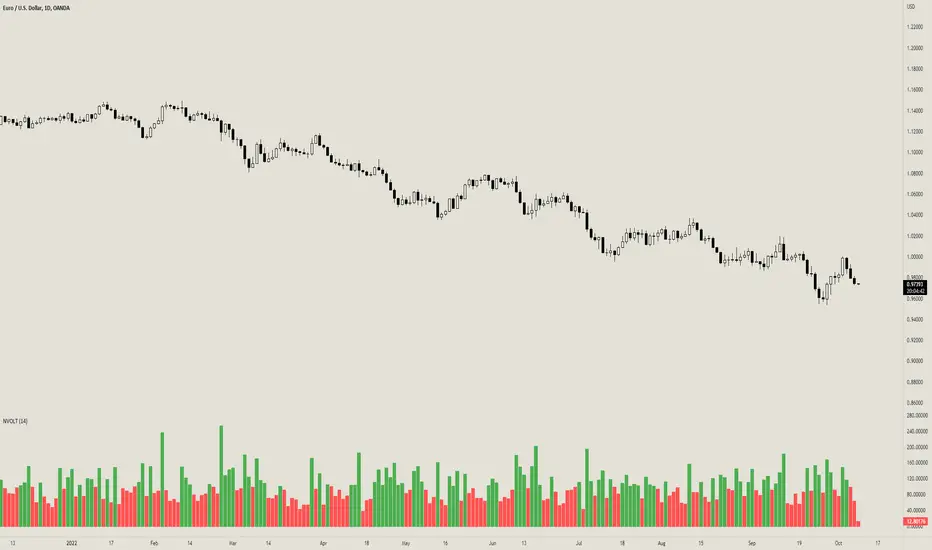
HOW DO I READ THIS INDICATOR
When the column's color is red, don't take any trend trades since the current volatility is less than the average volatility experienced in the market.
When the column's color is green, take all valid with-trend trades since the current volatility is greater than the average volatility experienced in the market.
The Normalized Volatility indicator is a technical indicator that gauges the amount of volatility currently present in the market, relative to the average volatility in the market. The purpose of this indicator is to filter out with-trend signals during ranging/non-trending/consolidating conditions.
CONCEPTS
This indicator assists traders in capitalizing on the assumption that trends are more likely to start during periods of high volatility compared to periods of low volatility. This is because high volatility indicates that there are bigger players currently in the market, which is necessary to begin a sustained trending move.
So, to determine whether the current volatility is "high", it is compared to an average volatility for however number of candles back the user specifies.
If the current volatility is greater than the average volatility, it is reasonable to assume we are in a high-volatility period. Thus, this is the ideal time to enter a trending trade due to the assumption that trends are more likely to start during these high-volatility periods.
HOW DO I READ THIS INDICATOR
When the column's color is red, don't take any trend trades since the current volatility is less than the average volatility experienced in the market.
When the column's color is green, take all valid with-trend trades since the current volatility is greater than the average volatility experienced in the market.
Skrip sumber terbuka
Dalam semangat TradingView sebenar, pencipta skrip ini telah menjadikannya sumber terbuka, jadi pedagang boleh menilai dan mengesahkan kefungsiannya. Terima kasih kepada penulis! Walaupuan anda boleh menggunakan secara percuma, ingat bahawa penerbitan semula kod ini tertakluk kepada Peraturan Dalaman.
Penafian
Maklumat dan penerbitan adalah tidak bertujuan, dan tidak membentuk, nasihat atau cadangan kewangan, pelaburan, dagangan atau jenis lain yang diberikan atau disahkan oleh TradingView. Baca lebih dalam Terma Penggunaan.