OPEN-SOURCE SCRIPT
Custom SMA Plot
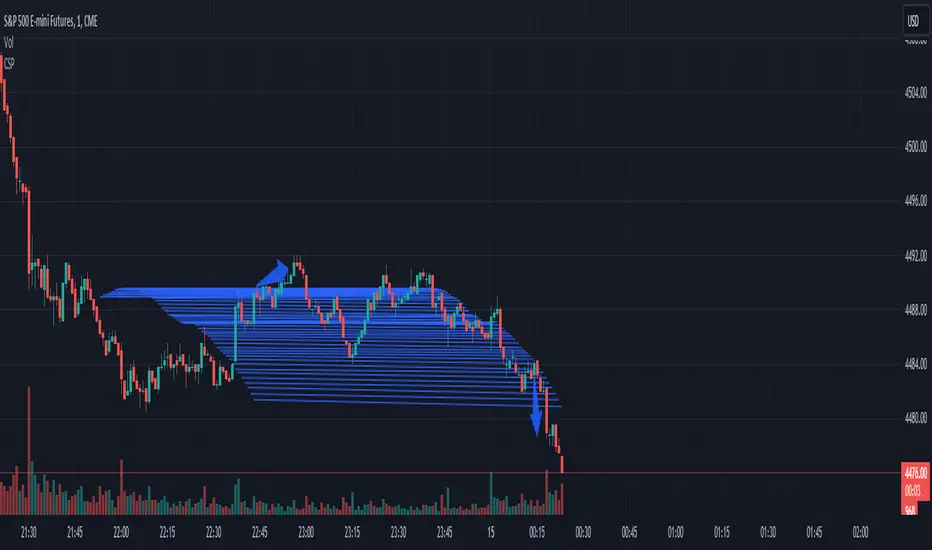
It creates a custom indicator named "Custom SMA Plot (CSP)" that overlays on a price chart. The indicator fetches the closing prices and calculates a 14-period simple moving average (SMA) of these prices. This SMA is then visually represented as a blue line, which starts from the SMA value of the bar 100 candles ago and extends to the current bar's SMA value. The line has a thickness of 1 unit.
When price breaks over wave go long.
When price breaks below wave go short.
When price breaks over wave go long.
When price breaks below wave go short.
Skrip sumber terbuka
Dalam semangat TradingView sebenar, pencipta skrip ini telah menjadikannya sumber terbuka, jadi pedagang boleh menilai dan mengesahkan kefungsiannya. Terima kasih kepada penulis! Walaupuan anda boleh menggunakan secara percuma, ingat bahawa penerbitan semula kod ini tertakluk kepada Peraturan Dalaman.
Penafian
Maklumat dan penerbitan adalah tidak bertujuan, dan tidak membentuk, nasihat atau cadangan kewangan, pelaburan, dagangan atau jenis lain yang diberikan atau disahkan oleh TradingView. Baca lebih dalam Terma Penggunaan.