PROTECTED SOURCE SCRIPT
IB Range & Volume Calculator
IB Range & Volume Calculator - Summary
Overview
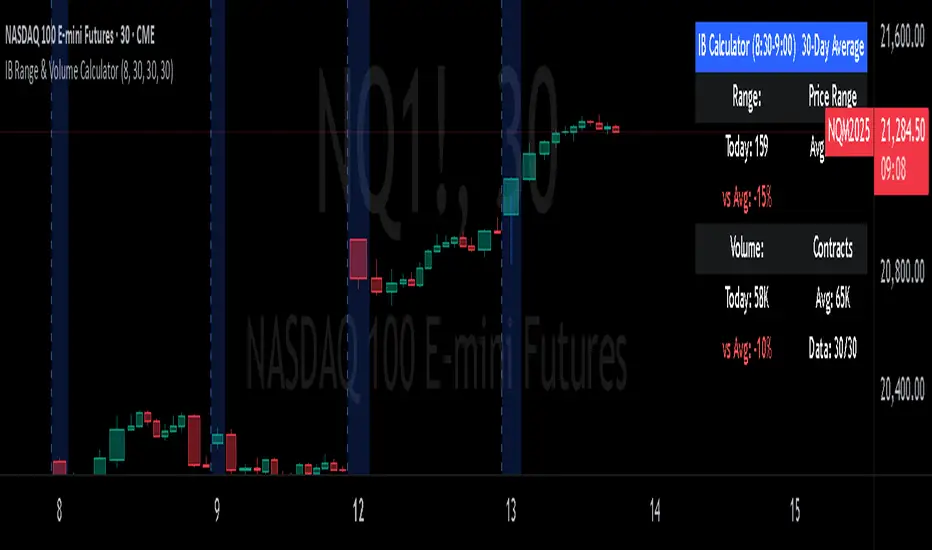
This indicator tracks and analyzes the Initial Balance (IB) period (first 30 minutes of trading from 8:30-9:00 AM Chicago time) by measuring both price range and trading volume. It compares today's values against a 30-day average, providing essential context for day traders and scalpers.
Key Features
Range Analysis
Automatically calculates high-low range during the Initial Balance period
Compares today's range with the 30-day historical average
Shows percentage difference from average with color coding (green for above average, red for below)
Volume Analysis
Tracks cumulative volume during the Initial Balance period
Calculates and displays 30-day volume average
Compares today's volume to the average with percentage difference
Visual Elements
Highlights all IB period candles with light blue background
Displays a fixed information panel in the upper right corner
Shows real-time status during the IB period ("In progress...")
Updates with final values once the IB period completes
Data Management
Maintains a rolling 30-day history of both range and volume data
Displays data collection progress (x/30 days)
Automatically resets calculations at the beginning of each new session
Trading Applications
This indicator is particularly valuable for:
Context-Based Trading Decisions
Compare today's market behavior to normal conditions
Adjust scalping targets based on relative volatility
Volume-Price Relationship Analysis
Identify unusual volume patterns that may precede significant moves
Validate price movements with corresponding volume confirmation
Trading Strategy Selection
High volume + high range: Momentum strategy opportunities
High volume + low range: Potential breakout setup
Low volume + high range: Possible fade/reversal opportunities
Low volume + low range: Range-bound scalping environment
5-Point Scalp Targeting
Determine if 5-point targets are aggressive or conservative for the day
Adapt stop levels based on relative volatility
Timing Optimization
Identify days with abnormal opening characteristics
Anticipate potential afternoon behavior based on IB patterns
The indicator provides essential context for rapid decision-making in fast-moving markets, helping traders calibrate their expectations and adapt their strategies to current market conditions.
Overview
This indicator tracks and analyzes the Initial Balance (IB) period (first 30 minutes of trading from 8:30-9:00 AM Chicago time) by measuring both price range and trading volume. It compares today's values against a 30-day average, providing essential context for day traders and scalpers.
Key Features
Range Analysis
Automatically calculates high-low range during the Initial Balance period
Compares today's range with the 30-day historical average
Shows percentage difference from average with color coding (green for above average, red for below)
Volume Analysis
Tracks cumulative volume during the Initial Balance period
Calculates and displays 30-day volume average
Compares today's volume to the average with percentage difference
Visual Elements
Highlights all IB period candles with light blue background
Displays a fixed information panel in the upper right corner
Shows real-time status during the IB period ("In progress...")
Updates with final values once the IB period completes
Data Management
Maintains a rolling 30-day history of both range and volume data
Displays data collection progress (x/30 days)
Automatically resets calculations at the beginning of each new session
Trading Applications
This indicator is particularly valuable for:
Context-Based Trading Decisions
Compare today's market behavior to normal conditions
Adjust scalping targets based on relative volatility
Volume-Price Relationship Analysis
Identify unusual volume patterns that may precede significant moves
Validate price movements with corresponding volume confirmation
Trading Strategy Selection
High volume + high range: Momentum strategy opportunities
High volume + low range: Potential breakout setup
Low volume + high range: Possible fade/reversal opportunities
Low volume + low range: Range-bound scalping environment
5-Point Scalp Targeting
Determine if 5-point targets are aggressive or conservative for the day
Adapt stop levels based on relative volatility
Timing Optimization
Identify days with abnormal opening characteristics
Anticipate potential afternoon behavior based on IB patterns
The indicator provides essential context for rapid decision-making in fast-moving markets, helping traders calibrate their expectations and adapt their strategies to current market conditions.
Skrip dilindungi
Skrip ini diterbitkan sebagai sumber tertutup. Akan tetapi, anda boleh menggunakannya secara bebas dan tanpa apa-apa had – ketahui lebih di sini.
Penafian
Maklumat dan penerbitan adalah tidak bertujuan, dan tidak membentuk, nasihat atau cadangan kewangan, pelaburan, dagangan atau jenis lain yang diberikan atau disahkan oleh TradingView. Baca lebih dalam Terma Penggunaan.