OPEN-SOURCE SCRIPT
Telah dikemas kini Ehlers Adaptive RSI
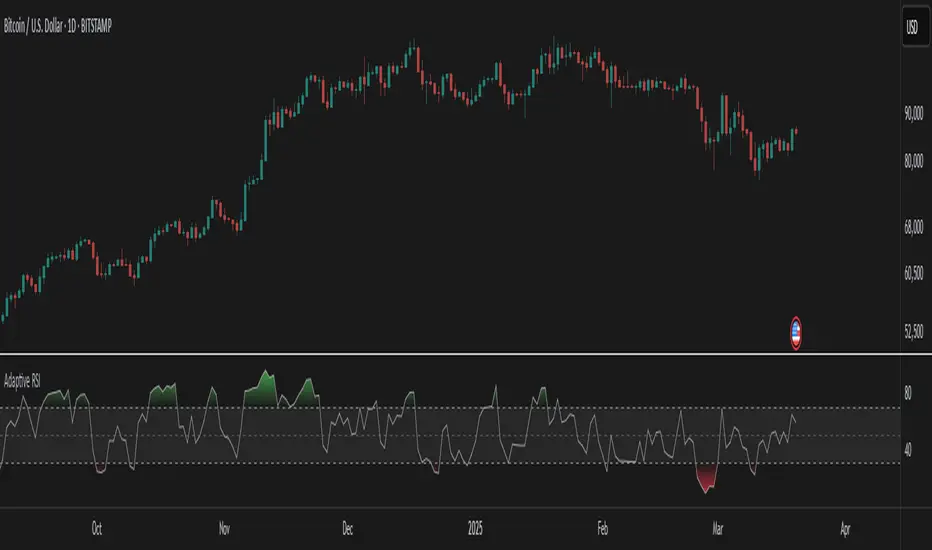
The Ehlers Adaptive RSI improves on the traditional RSI by dynamically adjusting its period based on market conditions.
Problem with the Classic RSI:
The traditional Relative Strength Index (RSI) uses a fixed period (e.g., 14), making it slow to react in volatile markets and too sensitive in stable conditions.
How the Adaptive RSI Solves This:
Instead of a fixed period, this version automatically adapts based on market volatility using a combination of ATR (Average True Range) and EMA (Exponential Moving Average).
Key Benefits:
This script is for informational and educational purposes only. It does not constitute financial advice, and past performance does not guarantee future results. Use it at your own risk.
Problem with the Classic RSI:
The traditional Relative Strength Index (RSI) uses a fixed period (e.g., 14), making it slow to react in volatile markets and too sensitive in stable conditions.
How the Adaptive RSI Solves This:
Instead of a fixed period, this version automatically adapts based on market volatility using a combination of ATR (Average True Range) and EMA (Exponential Moving Average).
Key Benefits:
- More Responsive – Quickly adapts to market shifts, reducing lag.
- Less Noise – Filters out unnecessary fluctuations in stable trends.
- Self-Adjusting – No need to manually change RSI settings for different market conditions.
- Better Signal Accuracy – Helps detect real trend reversals without false alarms.
This script is for informational and educational purposes only. It does not constitute financial advice, and past performance does not guarantee future results. Use it at your own risk.
Nota Keluaran
Update: This update does not modify the script’s functionality. It only improves the description to provide a clearer explanation of how the indicator works, its originality, and how traders can use it effectively.Ehlers Adaptive RSI
Overview
The Ehlers Adaptive RSI enhances the traditional Relative Strength Index (RSI) by dynamically adjusting its period based on market conditions. Unlike the classic RSI, which relies on a fixed period (e.g., 14), this adaptive version modifies its length automatically using a combination of ATR (Average True Range) and EMA (Exponential Moving Average). This approach, inspired by John Ehlers' work, makes the indicator more responsive to volatility and reduces noise in stable markets.
Why This Indicator?
The standard RSI has two main limitations:
- Fixed Period Issue: A single-length RSI does not adapt to changing market conditions.
- Lag in Volatile Markets: A long RSI period reacts too slowly to price movements.
- Excess Sensitivity in Stable Markets: A short RSI period generates excessive noise.
The Ehlers Adaptive RSI addresses these problems by dynamically adjusting the RSI length based on market volatility, allowing traders to get more accurate signals across different market phases.
How It Works
1. Adaptive Period Calculation
- The script calculates an adaptive period length based on ATR (volatility measure) and EMA (smoothing filter).
- This adaptive period length fluctuates between 5 and 30, ensuring that the RSI is neither too slow nor too sensitive.
2. Self-Adjusting RSI Calculation
- Gains and losses are calculated using a modified Wilder's method.
- The RSI period automatically expands during stable market conditions (reducing false signals).
- The RSI period contracts when volatility increases (making it more reactive to trends).
3. Enhanced Visualization
- The RSI line is displayed along with overbought (70) and oversold (30) levels.
- Gradient fills highlight overbought and oversold regions dynamically.
- A background fill helps traders quickly assess RSI conditions.
Customization Options
- Adaptive Period Length: Automatically adjusts between 5 and 30 based on market conditions.
- Overbought & Oversold Regions: Uses dynamic fills for clearer visualization.
- Midline Reference (50): Helps identify trend strength and potential reversals.
How to Use It
1. Identify Trend Reversals
- A break above 70 suggests overbought conditions (possible sell signal).
- A drop below 30 suggests oversold conditions (possible buy signal).
2. Follow Market Adaptation
- In high volatility, the RSI reacts faster, capturing short-term movements.
- In stable trends, the RSI smooths out noise, providing more reliable signals.
3. Confirm Entries with Other Indicators
- Use with moving averages or volume-based indicators for stronger confirmation.
Ideal for Traders Who:
- Want an adaptive momentum indicator that adjusts to market conditions.
- Trade trending and ranging markets where static RSI settings may be ineffective.
- Need a noise-filtered RSI that reacts only when necessary.
Important Considerations
- This indicator does not predict future price movements but adapts to current market conditions.
- Always use proper risk management and confirm signals with additional analysis.
- Market conditions change frequently, so periodic re-evaluation is recommended.
Final Thoughts
The Ehlers Adaptive RSI is a modernized version of the RSI that eliminates the drawbacks of a fixed period. By dynamically adjusting to market conditions, it provides better signal accuracy, reduced lag, and improved responsiveness, making it an essential tool for traders looking for more precise momentum analysis.
Nota Keluaran
Minor Update: Improved adaptive period logic for better cross-asset reliability.The original period calculation was based on raw ATR, which could produce inconsistent results across instruments with different price scales (e.g., BTC vs EURUSD). This update introduces a scale-invariant dynamic period, using the ATR relative to the average price.
Thanks to AtomOfScent for the constructive feedback and smart suggestion — much appreciated!
Functionally, the core logic remains the same, but this change ensures more consistent behavior across all markets.
Nota Keluaran
Minor Update: I made a small adjustment to the overbought and oversold lines, setting them to 60 and 40 instead of the traditional 70/30.Skrip sumber terbuka
Dalam semangat TradingView sebenar, pencipta skrip ini telah menjadikannya sumber terbuka, jadi pedagang boleh menilai dan mengesahkan kefungsiannya. Terima kasih kepada penulis! Walaupuan anda boleh menggunakan secara percuma, ingat bahawa penerbitan semula kod ini tertakluk kepada Peraturan Dalaman.
Plan the trade ⚡ Trade the plan
Penafian
Maklumat dan penerbitan adalah tidak bertujuan, dan tidak membentuk, nasihat atau cadangan kewangan, pelaburan, dagangan atau jenis lain yang diberikan atau disahkan oleh TradingView. Baca lebih dalam Terma Penggunaan.
Skrip sumber terbuka
Dalam semangat TradingView sebenar, pencipta skrip ini telah menjadikannya sumber terbuka, jadi pedagang boleh menilai dan mengesahkan kefungsiannya. Terima kasih kepada penulis! Walaupuan anda boleh menggunakan secara percuma, ingat bahawa penerbitan semula kod ini tertakluk kepada Peraturan Dalaman.
Plan the trade ⚡ Trade the plan
Penafian
Maklumat dan penerbitan adalah tidak bertujuan, dan tidak membentuk, nasihat atau cadangan kewangan, pelaburan, dagangan atau jenis lain yang diberikan atau disahkan oleh TradingView. Baca lebih dalam Terma Penggunaan.