Timeframe Titans: Market Structure & MTF Order Blocks
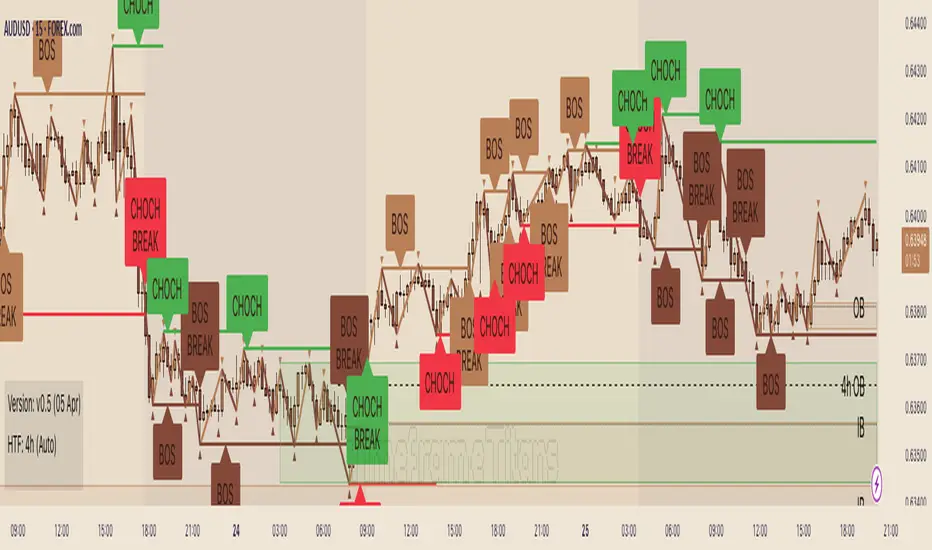
A combined market structure and order block indicator. Displays fractals, zigzags, Break Of Structure and Change Of Character lines. Shows order blocks on the chart and a higher timeframe.
Unique features include:
• The structure rules require counter fractals for BOS. This enables us to use more responsive fractal settings without creating excessive noise.
• Structure is strict. After the initial CHoCH there is always one and only one active CHoCH line.
• Order blocks can be filtered by market structure.
• Order blocks are based entirely on candle patterns (which appear to be unique among all the indicators we tested) instead of using pivots or other configurable calculations.
• Order blocks have separate mitigation levels, not merely the edge of the block, and being partially mitigated is a separate logical state.
🟩 WHAT IS MARKET STRUCTURE?
There are many ways to conceptualise and code market structure — the prevailing trend derived from important price levels. All of them start with identifying highs and lows in price, then use breaks of those levels to assign a trend.
This indicator displays the following market structure features:
• Williams Fractals to derive high and low pivots.
• Zigzag lines, which connect highs and lows.
• Break of Structure (BOS) lines, which are formed from the highest high in an *uptrend* or the lowest low in a *downtrend*. A break of a BOS line signals trend continuation.
• Change of Character (CHoCH) lines, which are formed from the highest high in a *downtrend* or the lowest low in an *uptrend*. A break of a CHoCH line signals trend reversal.
• Market structure bias, which is derived from the break of a CHoCH line. If a CHoCH line is broken to the upside, the trend is bullish, and if to the downside, bearish.
(For more details of the market structure features of this indicator, see the FEATURES OF THIS INDICATOR section.)
This definition of market structure implies that:
• There can only ever be one single active BOS line.
• There can only ever be one single active CHoCH line.
• A break of a BOS line creates a new CHoCH line.
• A break of a CHoCH line creates a new bias, a new BOS line, and a new CHoCH line.
• Before we can create a BOS, we need to know the bias, for which we need the CHoCH, for which we need BOS... just one of the chicken-vs-egg difficulties of coding market structure.
To understand how this indicator differs from other market structure indicators, see the COMPARISON WITH OTHER INDICATORS section.
🟩 WHAT ARE ORDER BLOCKS?
Order blocks are candle patterns that appear at highs and lows. The theory is that these areas are where many orders were filled — too many for the order book, causing an imbalance in buyers and sellers. As such, these areas can form support or resistance levels when price returns to them.
This indicator displays the following features related to order blocks:
• Imbalances, also called Fair Value Gaps.
• Order blocks of two different types (Imbalance Block and Standard Order Blocks)
(For more details of the order block features of this indicator, see the FEATURES OF THIS INDICATOR section.)
There are different patterns that can define order blocks, but the common element is that price should move vigorously away from the area after the pattern forms.
To understand how this indicator differs from other order block indicators, see the COMPARISON WITH OTHER INDICATORS section.
🟩 FEATURES OF THIS INDICATOR
Pivots
Shows Williams high and low fractals, with a configurable lookback. The pivots are always calculated, since they are the building block of all other market structure features. The pivot shape display can be turned on or off, and the display customised.
Zigzag
Draws lines between the highs and lows. The lines can be shown or hidden, and the colour and thickness configured.
Break of Structure
BOS lines are always calculated, but can be shown or hidden. The appearance can be customised. BOS lines are drawn from the candle that has the high or low that defines their level. They always extend until they are broken or the bias changes. The BOS lines have an optional, configurable label. When a BOS line is broken, an optional, configurable label is drawn on that bar.
Change of Character
CHoCH lines can be shown, hidden, and customised. CHoCH lines always extend until they are broken or a new CHoCH line is formed. CHoCH lines have optional labels. A different, customisable label is drawn when a CHoCH line is broken.
Market structure bias
Market structure bias is derived from the break of a CHoCH line. If a CHoCH line is broken to the upside, the trend is bullish, and if to the downside, bearish. The background is shaded a configurable colour based on the trend.
Imbalances
Imbalances are drawn in configurable colours. When they are mitigated, you can choose to change the colour, delete them, or leave them.
Order blocks
Two types of imbalance order blocks are displayed: Standard Order Blocks and Imbalance Blocks. They can be shown or hidden, and customised, independently.
Each order block has a mitigation line with configurable colours and style. If price exceeds the mitigation line, the order block is mitigated and is considered inactive.
The order blocks, or their labels, can be deleted when the order block is mitigated. If not deleted, their colour is changed and they no longer extend with each new bar.
Order blocks on the chart timeframe can be shown conditionally within the context of the market structure: you can choose to show:
• Pro-trend order blocks (bearish order blocks that were created in bearish market structure and vice-versa).
• Counter-trend order blocks (bearish order blocks that were created in bullish market structure and vice-versa).
• All order blocks.
Higher timeframe
Imbalances and order blocks can be independently shown and customised on a single higher timeframe. The HTF functions of this indicator do not repaint because they use confirmed data.
You can choose a custom, fixed higher timeframe, or an "Auto" mode where the script automatically chooses the higher timeframe based on the chart timeframe.
Script information messages
An optional table shows information about the script, including configuration problems, such as if a custom HTF is not actually higher than the chart timeframe.
🟩 HOW TO USE
There are very many ways to use market structure and order blocks in trading and we recommend you study extensively, and if possible get a trusted mentor.
Here is a random example we found on the recent GBPUSD chart. In the screenshot below, the left chart is at 30m and the right is at 5m. We've toggled various settings to make the chart clearer for demonstration purposes.
1 — We get a CHoCH break on the higher timeframe. So our bias (if we are trying to trade with the trend) is bearish. Now we look for some other confluence.
2 — Price revisits the top of the range and mitigates an imbalance block. It wicks the CHoCH (resetting it) but does not break it on close. The bearish market structure is thus preserved. For these reasons, we're thinking about a short, and we switch to the 5m chart on the right to find an entry. We've chosen a Custom HTF of 30m to match the left chart and we can see the mitigated HTF order block, marked "30m IB". We can see when price moves definitively out of the order block area to the downside.
3 — A bearish order block is formed and very quickly price comes back into it. We could enter a short here with a stop above the closest relevant fractal.
4 — Another bearish order block forms and price retests it. Another entry. Two previous 5m bullish order blocks at the bottom of the chart act as support. We could potentially close our short here.
5 — Another test of the same block, which was not mitigated the first time. Another potential short entry. As it happens, price makes a massive run lower here, such that we could trail our stop down one ATR above every single high fractal (marked out using manual rays and a public ATR indicator) for a good R:R, but that's not the point.
This is a made-up, retrofitted example with a fairly generic methodology. It's just to show how some of the features of this indicator could be used in trading:
• Market structure can give a bias. It can also mark interesting levels.
• Using multiple timeframes, while more complex, can level up your trading experience.
• Price trading back into order blocks can be a good R:R entry.
Your actual way of trading, your playbook of setups, your knowledge of your strengths and weakness as a trader, is your own.
🟩 LIMITATIONS
This indicator is intended for use on Forex markets, although order blocks and market structure do form on any reasonably liquid asset.
The HTF uses confirmed data, so you need to wait until the HTF bar is closed before the order block can form. Therefore it does not repaint, in the sense that people worry about repainting, of changing data in the past. We use the latest recommended method of fetching HTF data.
The market structure uses live chart data, so structure and order blocks that are created by conditions on an open realtime bar can appear and disappear as the current bar close changes. This is quite normal.
The Williams pivots are by definition only confirmed after a defined number of bars, and like everyone else we plot them offset into the past.
Similarly, we offset order blocks into the past so that they start on the candle that has the high or low that defines the order block, not the candle that created them. For HTF order blocks, we calculate the number of chart bars back assuming a 24-hour market, which gives accurate offsets only on Forex and other symbols that trade close to 24 hours each day.
🟩 COMPARISON WITH OTHER INDICATORS
There are a great number of market structure and order block indicators already published on TradingView. Since there are only a certain number of highs and lows on the chart from which to produce structure and order blocks, they all look somewhat similar. However, this indicator, written entirely from scratch without reference to the code of any other indicators, is unique and original in two kinds of ways: in patterns and in features.
PRECISE PATTERNS
We believe that edge in trading can be found in, amongst other things, precision in analysis. You can't truly trust your backtests if your system is not repeatable, and your system is repeatable only if its definitions are precise.
We trade with this indicator, and our students trade with it as well. Why did we spend months creating a new indicator instead of using one of the many existing ones, most of which are free and open source?
Because they are not quite how we wanted.
The indicator was created from our proprietary structure rules, which are based on the generally accepted understanding of market structure, with some specific tweaks.
To prepare this description (after the indicator is finished), we searched for "Market Structure", "CHoCH", and "SMC" and list below all popular (with over 3K boosts; excluding invite-only) indicators that show market structure with CHoCH (sometimes called MSS). We configured the settings to most closely match how our indicator works, added both indicators to the same chart, and looked for relevant differences.
The purpose of this section is not to try to say that this indicator is better than any other, but just that it is different. This difference is important for us and our students.
Indicator #1
As you can see, the indicator interpreted the first part of the chart as a downtrend, whereas ours interpreted it as an uptrend. The structure is completely different, because our Williams Fractal lookback is 2, and the minimum "Swing Points" value for Indicator #1 is 10. Although this indicator is deservedly popular, it isn't what we can use for the way we trade.
Indicator #2
Setting the "Zigzag Length" to 2 results in wildly different market structure, as shown below. For many fractals, this indicator does not place the zigzag at the highest high or lowest low, as ours does consistently. It does not highlight the trend in any way. It gives many Market Structure Breaks in a short period. Although it's again wildly popular, it doesn't match our way of encoding market structure.
Indicator #3
Again, setting the "Pivot lb" and "Pivot rb" inputs to 2 gives much too sensitive market structure. This is because this indicator does not require, as we do, a counter-fractal to form after a fractal in order to confirm a BOS. We believe that this rule gives less noisy structure while also being responsive. Most indicators attempt to compensate for this by having a much larger lookback period. While this does of course give fewer pivots and less noise, this is simply a different logic and gives different results. Note also that although this indicator correctly defines the first section of the chart as an uptrend, it does not draw a CHoCH line. As discussed above, our definition of market structure means that there should always be one and only one active CHoCH line, and we draw this at the earliest sensible opportunity.
Indicator #4
Again, the lack of any extra pivot confirmation logic means that this indicator creates different structure with the same lookback period. Also note the lack of initial CHoCH.
Indicator #5
The lowest lookback is 3, and so this indicator too gives very different structure.
Indicator #6
Of course, using a lookback of 2 gives different structure with this indicator too. For variety, here we show a lookback of 5, which is the lowest setting that returns significantly less noisy structure. You can see that the main CHoCH at the top of the chart is similar but not at the same place. Increasing the lookback does not ever result in a CHoCH at the same place, because the logic is simply different. When the lookback increases above 10, no CHoCH lines are drawn at the top at all.
Indicator #7
This indicator uses the highest/lowest price for the last 10 bars (fixed), along with some other bar conditions. You can see the resulting structure is quite different. Among other differences, it does not create a BOS at the top of the chart, even in an uptrend, and it does not create an opposing CHoCH when the existing CHoCH is broken.
Indicator #8
With "Custom" market structure and a length of 2, BOS and CHoCH lines are drawn by this indicator but in incongruous places.
Conclusion
Although we only illustrate the top few alternatives, we did check many, many others.
These market structure indicators may produce useful output, but their structure differs significantly from ours. We didn't even need to get into specific examples because the general approaches are so different. It is up to the user to decide which indicator, and which interpretation of market structure, best suits their needs.
ORDER BLOCKS
Continuing, we illustrate differences with the most popular order block indicators, trying to get them to match our order blocks. Note that some of these are also in the previous list as market structure indicators.
Order blocks are always formed at swings when price moves away with force, so they will be sort of the same across all the very many existing order block indicators. We are looking for precision and differentiation, as we did with market structure.
Indicator #1
This indicator does not have ability to display mitigated order blocks, only active ones. The order blocks do not match at all.
Indicator #2
With a period of 2, this indicator marks many of the same order blocks as ours. It doesn't extend the blocks, and doesn't mark them when mitigated. The logic for choosing the order block candle is also clearly different.
Indicator #3
Even with very sensitive settings, this indicator did not create as many order blocks as ours and they are quite different.
Indicator #4
Again you can see the logic for choosing candles and creating blocks is simply different. This indicator has inadequate protection against empty arrays, which causes runtime errors on charts with not much history (not a problem for Forex charts in general, but noticeable on the testing chart).
Indicator #5
We were unable to get the order blocks to extend with this indicator, although it should be possible. Anyway the blocks are wildly different.
Indicator #6
Even with the most sensitive settings, this indicator showed only one order block on our test chart.
Indicator #7
This indicator incorporates complex price action concepts. Nevertheless, the order blocks are very different indeed.
Indicator #8
This indicator forms quite different blocks to ours. It has several interesting settings including a choice of using the candle body or wick.
Indicator #9
We were not able to configure this indicator to produce the same order blocks as ours.
Indicator #10
On very sensitive settings, this indicator matches many of our order blocks, but at the same time many are different.
Conclusion
None of the indicators tested here (nor the many others we looked at previously) use the same logic as ours. The differences are so obvious that we don't have to call out individual blocks and analyse how they differ.
Fundamentally, other indicators seem to use variable precision for pivots in their order block detection calculations. Our order blocks are pure candle patterns with two different rulesets for Standard Order Blocks and Imbalance Order Blocks, and this logic does not change.
Note that our order blocks do not always automatically extend to the swing high or low, nor allow the user to choose the limit of the block, but use unique rules.
In summary, our indicator differs from other order block indicators in terms of fundamental detection logic, candle placement, boundary definition, mitigation levels, and logical states (see below).
UNIQUE COMBINATION OF FEATURES
In comparison to all other indicators we looked at, our indicator:
• Uses order blocks with three states: active, mitigated, and partially mitigated. Our mitigation lines for order blocks are rules-based. If price touches the mitigation line, the order block is considered fully mitigated. If price goes inside the order block but does not hit the mitigation line, it is only partially mitigated. These three states are visually distinguished.
• Has the most extensive visual customisation options of all those we looked at. We believe that being able to customise how you see indicator outputs is very important for reducing mental load while analysing and trading.
• Has a unique feature that combines market structure and order blocks, where the user can choose to show pro-trend order blocks (bullish blocks that are formed in bullish structure and vice-versa) or counter-trend blocks (bullish blocks that are formed in bearish structure and vice-versa).
• Approximates an initial trend bias very quickly, so we can start creatng BOS, CHoCH, etc.
• Requires a counter pivot to confirm a BOS line. This seemingly small logical step actually creates very different structure, as we saw in the comparison section.
• Uses a sophisticated array-based sorting mechanism to preserve the selected number of imbalances, use the rest of the TradingView box allowance for order blocks, and delete excess order block objects (not just drawings) in reverse historical order.
• Hides order block drawings if they are a configurable distance away from price. Magically redraws them if price moves closer.
• Includes an equivalent to the system "Calculated bars" setting for the high timeframe, to avoid unnecessary processing and improve performance.
🟩 CODING CONSIDERATIONS
This indicator consists of all original code written by @SimpleCryptoLife for Timeframe_Titans.
AI was used for the following purposes:
• Autocomplete
• Checking that bullish and bearish logic is parallel in a given function
• Querying the names and locations of variables hundreds of lines away when we forgot what they're called, like an expensive search-and-replace
• Help with debugging (it usually makes up elaborate and wrong ideas though)
It was not used to replace the coder's expertise and creativity, or to "vibe-code" some black-box functionality we didn't understand. We can recommend that you use AI the same way.
═════════════════════════════════════════════════════════════
+ Correct the starting index of CHoCH lines on an opposing ChoCH break.
+ Rounded prices to the chart mintick, which ensures that BOS confirmations and order block confirmations behave as expected when OHLC prices are very close to each other.
Skrip jemputan sahaja
Hanya pengguna disahkan oleh penulis boleh mengakses skrip ini. Anda perlu memohon dan mendapatkan kebenaran untuk menggunakannya. Keizinan selalunya diberikan selepas pembayaran. Untuk lebih butiran, ikuti arahan penulis di bawah atau hubungi Timeframe_Titans secara terus.
TradingView TIDAK menyarankan pembayaran atau penggunaan skrip kecuali anda mempercayai sepenuhnya penulis dan memahami bagaimana ia berfungsi. Anda juga boleh menjumpai alternatif sumber terbuka dan percuma yang lain di dalam skrip komuniti kami.
Arahan penulis
Penafian
Skrip jemputan sahaja
Hanya pengguna disahkan oleh penulis boleh mengakses skrip ini. Anda perlu memohon dan mendapatkan kebenaran untuk menggunakannya. Keizinan selalunya diberikan selepas pembayaran. Untuk lebih butiran, ikuti arahan penulis di bawah atau hubungi Timeframe_Titans secara terus.
TradingView TIDAK menyarankan pembayaran atau penggunaan skrip kecuali anda mempercayai sepenuhnya penulis dan memahami bagaimana ia berfungsi. Anda juga boleh menjumpai alternatif sumber terbuka dan percuma yang lain di dalam skrip komuniti kami.