PROTECTED SOURCE SCRIPT
RAFA's SMC Killer LITE
What is the SMC Killer?
The Smart Money Concepts (SMC) Killer is a trading indicator that identifies high-probability entry points using three proven strategies:
Break of Structure (BOS) - Trades when price breaks key support/resistance levels
Fair Value Gap (FVG) - Enters when price fills gaps in the market
Order Blocks (OB) - Entry from institutional order clusters (optional display)
This indicator automatically:
✅ Calculates correct entry, take-profit, and stop-loss levels for your asset
✅ Tracks win/loss statistics in real-time
✅ Works on 30+ different futures contracts
✅ Adapts tick size and point value automatically
Asset Selection
Supported Assets
The indicator supports all major futures contracts:
Equity Futures:
ES (E-mini S&P 500)
NQ (E-mini NASDAQ 100)
YM (Mini Dow Jones)
NKD (Nikkei 225)
EMD (E-mini Midcap 400)
RTY (Russell 2000)
Currency Futures:
6A (Australian Dollar)
6B (British Pound)
6C (Canadian Dollar)
6E (Euro FX)
6J (Japanese Yen)
6S (Swiss Franc)
6N (New Zealand Dollar)
Agricultural Futures:
HE (Lean Hogs)
LE (Live Cattle)
GF (Feeder Cattle)
ZC (Corn)
ZW (Wheat)
ZS (Soybeans)
ZM (Soybean Meal)
ZL (Soybean Oil)
Energy Futures:
CL (Crude Oil)
QM (Mini Crude Oil)
NG (Natural Gas)
QG (E-mini Natural Gas)
HO (Heating Oil)
RB (RBOB Gasoline)
Metal Futures:
GC (Gold)
SI (Silver)
HG (Copper)
PL (Platinum)
PA (Palladium)
QI (E-mini Silver)
QO (E-mini Gold)
Micro Futures:
MES (Micro E-mini S&P 500)
MYM (Micro E-mini Dow Jones)
MNQ (Micro E-mini NASDAQ)
M2K (Micro Russell 2000)
MGC (E-Micro Gold)
M6A (E-Micro AUD/USD)
M6E (E-Micro EUR/USD)
MCL (Micro Crude Oil)
How to Select Your Asset
Open the indicator settings (click ⚙️)
Go to ASSET SELECT section
Select Asset Category (e.g., "Metal Futures")
Enter Select Asset Symbol (e.g., "GC" for Gold)
Click OK
The indicator will automatically load the correct:
✅ Tick size
✅ Point value
✅ Risk/reward calculations
Settings Configuration
ASSET SELECT Group
Asset Category: [Dropdown] Choose from 6 categories
Select Asset Symbol: [Text Input] Enter symbol (ES, GC, CL, etc.)
STRUCTURE Group
Show Swing Structure: [ON/OFF] Display swing highs/lows
Swing Length: [2-20] Bars used for pivot detection (default: 5)
Build Sweep: [ON/OFF] Show sweep formations (default: ON)
What it does: Identifies the market trend and key turning points
Teal/Green bars = Uptrend
Orange/Red bars = Downtrend
FVG Group
Enable FVG Entry: [ON/OFF] Use Fair Value Gap strategy
FVG Threshold: [0-2] Sensitivity filter (default: 0)
What it does: Detects gaps in price action that indicate imbalance
Lower threshold = More signals
Higher threshold = Fewer, high-quality signals
RISK Group
Show Bracket: [ON/OFF] Display entry/TP/SL lines
Units/Contracts: [1-100] Number of contracts to trade (default: 6)
Stop Loss ($): [$] Risk amount per trade (default: $250)
Target ($): [$] Profit target per trade (default: $1,000)
Example: If you select ES with $250 stop loss:
The indicator calculates: 250 ÷ (6 contracts × $50 per point) = 0.83 points
Your stop loss line appears 0.83 points below entry
TABLE Group
Show Statistics: [ON/OFF] Display results table
Position: [Dropdown] Table location (default: top_right)
Year: [2020-2100] Start tracking from this year
Month: [1-12] Start tracking from this month
Day: [1-31] Start tracking from this day
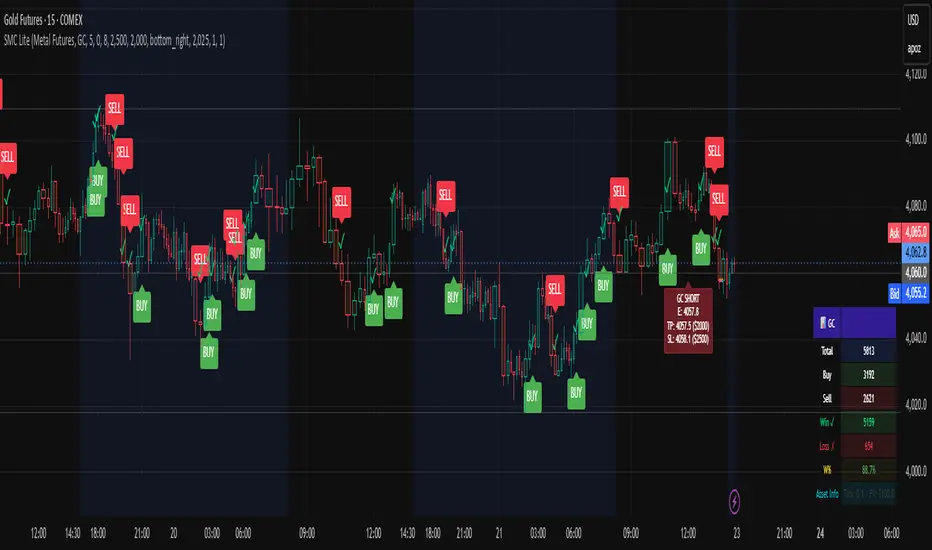
Trading Signals
BUY Signal 🟢
When you see a green "BUY" label below a candle:
Price is breaking higher (Break of Structure)
OR price is filling a gap (Fair Value Gap)
The indicator plots three lines:
Green line = Entry price
Lime/bright green line = Take Profit level
Red line = Stop Loss level
Action: Consider entering a LONG position at market or entry price
SELL Signal 🔴
When you see a red "SELL" label above a candle:
Price is breaking lower (Break of Structure)
OR price is filling a gap (Fair Value Gap)
The indicator plots three lines:
Red line = Entry price
Magenta/pink line = Take Profit level
Orange line = Stop Loss level
Action: Consider entering a SHORT position at market or entry price
Signal Confirmation
✅ Wait for confirmation - Only trade signals on confirmed (closed) bars
✅ Check the trend - Look at candle colors (green uptrend, orange downtrend)
✅ Risk/reward ratio - TP should be at least 2x your SL risk
Risk Management
Position Sizing Example
Trading Gold (GC) with ES Settings:
Units: 6 contracts
Stop Loss: $250
Target: $1,000
Tick Size: 0.1 (automatic for GC)
Point Value: $100 per point (automatic for GC)
Risk per trade: $250
Reward per trade: $1,000
Risk/Reward Ratio: 1:4 (Excellent!)
Stop Loss Strategy
Always place your stop loss below/above the entry lines
The red/orange line shows exactly where to place SL
Never move your stop loss against the trade (unless scaling)
Use hard stops - set them immediately upon entry
Take Profit Strategy
Take profits at the lime/magenta line (TP level)
Consider taking partial profits at 50% of target
Let remaining 50% run to full target
Use trailing stops if price moves in your favor
Risk Per Trade
Formula: (Stop Loss $) ÷ (Units × Point Value)
Example for ES:
Stop Loss: $250
Units: 6
Point Value: $50
Risk per point: 250 ÷ (6 × 50) = 0.83 points
Reading the Chart
Visual Elements
Candle Colors:
🟩 Green/Teal = Uptrend (higher highs and higher lows)
🟥 Orange/Red = Downtrend (lower highs and lower lows)
Signal Labels:
BUY (Green) = Long entry opportunity
SELL (Red) = Short entry opportunity
Bracket Lines:
Entry Line (Solid) = Your entry price
TP Line (Bright color) = Take profit target
SL Line (Red/Orange) = Stop loss level
Success Markers:
✓ (Green checkmark) = Trade hit TP (WIN)
✗ (Red X) = Trade hit SL (LOSS)
Statistics Table
What Each Column Means
📊 [ASSET SYMBOL] ← Current asset being traded
├── Total: Total signals generated (buys + sells)
├── Buy: Number of buy signals
├── Sell: Number of sell signals
├── Win ✓: Trades that hit take profit
├── Loss ✗: Trades that hit stop loss
├── W%: Win rate percentage (wins ÷ total trades)
└── Asset Info: Tick size and point value
Example Reading
📊 ES
Total: 15
Buy: 8
Sell: 7
Win ✓: 10
Loss ✗: 5
W%: 66.7%
Asset Info: Tick: 0.25 | PV: $50
This means:
15 total signals since tracking started
10 wins, 5 losses
66.7% win rate (Professional level!)
Trading ES with 0.25 tick and $50 point value
Trading Examples
Example 1: Gold (GC) Long Trade
Setup:
Asset: Metal Futures → GC
Stop Loss: $150
Target: $600
Units: 2 contracts
What happens:
You see a BUY label on a green candle
Entry line at 2050.0
TP line at 2050.6 (0.6 points higher = $600 profit)
SL line at 2049.85 (0.15 points lower = $150 loss)
Risk/Reward: 1:4 ✅
Trade Result:
Price moves to 2050.6 → Label shows ✓ = WIN
Table updates: Wins increases by 1, Win% increases
Example 2: Crude Oil (CL) Short Trade
Setup:
Asset: Energy Futures → CL
Stop Loss: $500
Target: $2,000
Units: 1 contract
What happens:
You see a SELL label on a red candle
Entry line at 78.50
TP line at 77.50 (1.00 lower = $1,000 profit)
SL line at 79.00 (0.50 higher = $500 loss)
Risk/Reward: 1:2 ✅
Trade Result:
Price drops to 77.50 → Label shows ✓ = WIN
Table updates: Wins increases by 1, Win% increases
Example 3: E-mini S&P (ES) Day Trading
Setup:
Asset: Equity Futures → ES
Stop Loss: $250
Target: $1,000
Units: 6 contracts
Swap Length: 5 (default)
Enable FVG: ON
Morning Session:
See BUY at 5860.25 (swing break)
Hit TP at 5861.08 = WIN ✓
Table shows: Total 1, Buy 1, Win 1, W% 100%
See SELL at 5861.50 (FVG entry)
Hit SL at 5860.67 = LOSS ✗
Table shows: Total 2, Sell 1, Win 1, L% 50%
By end of day: 4 wins, 1 loss, 80% win rate
Troubleshooting
Issue 1: No signals appearing
Solution:
Check if both Show Bracket is ON
Check if Enable FVG Entry is ON
Try changing Swing Length (lower = more signals)
Ensure you're on a 1-hour or higher timeframe
Check chart has enough data (scroll left to see history)
Issue 2: Signals appear but no entry lines
Solution:
Confirm Show Bracket is toggled ON
Check Stop Loss ()andTarget() and Target (
)andTarget() are reasonable amounts
Ensure your Units value is not 0
Try refreshing the chart
Issue 3: Asset not recognized
Solution:
Check spelling of symbol (ES, not E-S)
Verify asset is in the supported list
Check you're in the correct category
Try closing and reopening the chart
Issue 4: Wrong stop loss/target levels
Solution:
Verify correct asset is selected
Check Units setting matches your position size
Verify Stop Loss ($) and Target ($) amounts
Look at Asset Info in table to confirm tick size
Manually calculate: SL $ ÷ (Units × Point Value) = Points
Issue 5: Statistics table not showing
Solution:
Toggle Show Statistics OFF then back ON
Try changing Table Position
Refresh the chart
Check that Show Table is enabled in settings
Issue 6: Indicator acting "heavy" or laggy
Solution:
Turn off Show Swing Structure if not needed
Turn off Show Bracket if reviewing historical trades
Reduce chart's data window (don't load entire years)
Refresh the chart
Pro Tips 🚀
Tip 1: Start with Micro Futures
Micro contracts (MES, MNQ, MCL) have lower cost
Perfect for learning the strategy
Same quality signals, smaller risk
Tip 2: Trade During Peak Hours
Equity Futures: 9:30-16:00 ET (Regular session)
Energy: 18:00-16:00 CT (After hours active)
Metals: 18:00-17:00 CT (Most liquid)
Currencies: 5:00 PM - 4:00 PM ET (24-5 market)
Tip 3: Combine Timeframes
Look for entry on 1-hour chart
Confirm on 15-minute chart
Execute on 5-minute breakout
More confluence = higher probability
Tip 4: Track Your Trades
Keep notes on WIN/LOSS trades
Identify patterns in your losses
Adjust settings based on performance
Use Win% table to monitor improvement
Tip 5: Risk Management First
Never risk more than 2% of account per trade
Respect your stop loss (don't move it)
Take profits when levels are hit
Be patient for high-probability setups
Tip 6: Adjust for Market Conditions
Trending markets: Increase Swing Length (6-8)
Choppy markets: Decrease Swing Length (2-4)
Low volatility: Reduce Stop Loss $
High volatility: Increase Target $
Quick Reference Card
────────────────────────────────────────────────────
SMC KILLER QUICK START ─────────────────────────────────────────────────────
│ 1. Select Asset Category & Symbol
│ 2. Set Units (contracts)
│ 3. Set Stop Loss ($) - your max risk
│ 4. Set Target ($) - your profit goal
│ 5. Wait for BUY (green) or SELL (red) signal
│ 6. Place entry at the entry line
│ 7. Place stop at the red/orange line
│ 8. Place take-profit at the lime/magenta line
│ 9. Close trade when line closes (✓ or ✗)
│ 10. Review statistics and adjust next trade
└─────────────────────────────────────────────────────
BUY Signal = Break Higher OR Fill Gap = LONG
SELL Signal = Break Lower OR Fill Gap = SHORT
Green candles = Uptrend
Orange candles = Downtrend
✓ = Win (took profit)
✗ = Loss (hit stop)
Support & Updates
Check settings are correct for your asset
Ensure adequate chart data is loaded
Test on demo account first
Start with smallest position size
Track performance over 20+ trades
The Smart Money Concepts (SMC) Killer is a trading indicator that identifies high-probability entry points using three proven strategies:
Break of Structure (BOS) - Trades when price breaks key support/resistance levels
Fair Value Gap (FVG) - Enters when price fills gaps in the market
Order Blocks (OB) - Entry from institutional order clusters (optional display)
This indicator automatically:
✅ Calculates correct entry, take-profit, and stop-loss levels for your asset
✅ Tracks win/loss statistics in real-time
✅ Works on 30+ different futures contracts
✅ Adapts tick size and point value automatically
Asset Selection
Supported Assets
The indicator supports all major futures contracts:
Equity Futures:
ES (E-mini S&P 500)
NQ (E-mini NASDAQ 100)
YM (Mini Dow Jones)
NKD (Nikkei 225)
EMD (E-mini Midcap 400)
RTY (Russell 2000)
Currency Futures:
6A (Australian Dollar)
6B (British Pound)
6C (Canadian Dollar)
6E (Euro FX)
6J (Japanese Yen)
6S (Swiss Franc)
6N (New Zealand Dollar)
Agricultural Futures:
HE (Lean Hogs)
LE (Live Cattle)
GF (Feeder Cattle)
ZC (Corn)
ZW (Wheat)
ZS (Soybeans)
ZM (Soybean Meal)
ZL (Soybean Oil)
Energy Futures:
CL (Crude Oil)
QM (Mini Crude Oil)
NG (Natural Gas)
QG (E-mini Natural Gas)
HO (Heating Oil)
RB (RBOB Gasoline)
Metal Futures:
GC (Gold)
SI (Silver)
HG (Copper)
PL (Platinum)
PA (Palladium)
QI (E-mini Silver)
QO (E-mini Gold)
Micro Futures:
MES (Micro E-mini S&P 500)
MYM (Micro E-mini Dow Jones)
MNQ (Micro E-mini NASDAQ)
M2K (Micro Russell 2000)
MGC (E-Micro Gold)
M6A (E-Micro AUD/USD)
M6E (E-Micro EUR/USD)
MCL (Micro Crude Oil)
How to Select Your Asset
Open the indicator settings (click ⚙️)
Go to ASSET SELECT section
Select Asset Category (e.g., "Metal Futures")
Enter Select Asset Symbol (e.g., "GC" for Gold)
Click OK
The indicator will automatically load the correct:
✅ Tick size
✅ Point value
✅ Risk/reward calculations
Settings Configuration
ASSET SELECT Group
Asset Category: [Dropdown] Choose from 6 categories
Select Asset Symbol: [Text Input] Enter symbol (ES, GC, CL, etc.)
STRUCTURE Group
Show Swing Structure: [ON/OFF] Display swing highs/lows
Swing Length: [2-20] Bars used for pivot detection (default: 5)
Build Sweep: [ON/OFF] Show sweep formations (default: ON)
What it does: Identifies the market trend and key turning points
Teal/Green bars = Uptrend
Orange/Red bars = Downtrend
FVG Group
Enable FVG Entry: [ON/OFF] Use Fair Value Gap strategy
FVG Threshold: [0-2] Sensitivity filter (default: 0)
What it does: Detects gaps in price action that indicate imbalance
Lower threshold = More signals
Higher threshold = Fewer, high-quality signals
RISK Group
Show Bracket: [ON/OFF] Display entry/TP/SL lines
Units/Contracts: [1-100] Number of contracts to trade (default: 6)
Stop Loss ($): [$] Risk amount per trade (default: $250)
Target ($): [$] Profit target per trade (default: $1,000)
Example: If you select ES with $250 stop loss:
The indicator calculates: 250 ÷ (6 contracts × $50 per point) = 0.83 points
Your stop loss line appears 0.83 points below entry
TABLE Group
Show Statistics: [ON/OFF] Display results table
Position: [Dropdown] Table location (default: top_right)
Year: [2020-2100] Start tracking from this year
Month: [1-12] Start tracking from this month
Day: [1-31] Start tracking from this day
Trading Signals
BUY Signal 🟢
When you see a green "BUY" label below a candle:
Price is breaking higher (Break of Structure)
OR price is filling a gap (Fair Value Gap)
The indicator plots three lines:
Green line = Entry price
Lime/bright green line = Take Profit level
Red line = Stop Loss level
Action: Consider entering a LONG position at market or entry price
SELL Signal 🔴
When you see a red "SELL" label above a candle:
Price is breaking lower (Break of Structure)
OR price is filling a gap (Fair Value Gap)
The indicator plots three lines:
Red line = Entry price
Magenta/pink line = Take Profit level
Orange line = Stop Loss level
Action: Consider entering a SHORT position at market or entry price
Signal Confirmation
✅ Wait for confirmation - Only trade signals on confirmed (closed) bars
✅ Check the trend - Look at candle colors (green uptrend, orange downtrend)
✅ Risk/reward ratio - TP should be at least 2x your SL risk
Risk Management
Position Sizing Example
Trading Gold (GC) with ES Settings:
Units: 6 contracts
Stop Loss: $250
Target: $1,000
Tick Size: 0.1 (automatic for GC)
Point Value: $100 per point (automatic for GC)
Risk per trade: $250
Reward per trade: $1,000
Risk/Reward Ratio: 1:4 (Excellent!)
Stop Loss Strategy
Always place your stop loss below/above the entry lines
The red/orange line shows exactly where to place SL
Never move your stop loss against the trade (unless scaling)
Use hard stops - set them immediately upon entry
Take Profit Strategy
Take profits at the lime/magenta line (TP level)
Consider taking partial profits at 50% of target
Let remaining 50% run to full target
Use trailing stops if price moves in your favor
Risk Per Trade
Formula: (Stop Loss $) ÷ (Units × Point Value)
Example for ES:
Stop Loss: $250
Units: 6
Point Value: $50
Risk per point: 250 ÷ (6 × 50) = 0.83 points
Reading the Chart
Visual Elements
Candle Colors:
🟩 Green/Teal = Uptrend (higher highs and higher lows)
🟥 Orange/Red = Downtrend (lower highs and lower lows)
Signal Labels:
BUY (Green) = Long entry opportunity
SELL (Red) = Short entry opportunity
Bracket Lines:
Entry Line (Solid) = Your entry price
TP Line (Bright color) = Take profit target
SL Line (Red/Orange) = Stop loss level
Success Markers:
✓ (Green checkmark) = Trade hit TP (WIN)
✗ (Red X) = Trade hit SL (LOSS)
Statistics Table
What Each Column Means
📊 [ASSET SYMBOL] ← Current asset being traded
├── Total: Total signals generated (buys + sells)
├── Buy: Number of buy signals
├── Sell: Number of sell signals
├── Win ✓: Trades that hit take profit
├── Loss ✗: Trades that hit stop loss
├── W%: Win rate percentage (wins ÷ total trades)
└── Asset Info: Tick size and point value
Example Reading
📊 ES
Total: 15
Buy: 8
Sell: 7
Win ✓: 10
Loss ✗: 5
W%: 66.7%
Asset Info: Tick: 0.25 | PV: $50
This means:
15 total signals since tracking started
10 wins, 5 losses
66.7% win rate (Professional level!)
Trading ES with 0.25 tick and $50 point value
Trading Examples
Example 1: Gold (GC) Long Trade
Setup:
Asset: Metal Futures → GC
Stop Loss: $150
Target: $600
Units: 2 contracts
What happens:
You see a BUY label on a green candle
Entry line at 2050.0
TP line at 2050.6 (0.6 points higher = $600 profit)
SL line at 2049.85 (0.15 points lower = $150 loss)
Risk/Reward: 1:4 ✅
Trade Result:
Price moves to 2050.6 → Label shows ✓ = WIN
Table updates: Wins increases by 1, Win% increases
Example 2: Crude Oil (CL) Short Trade
Setup:
Asset: Energy Futures → CL
Stop Loss: $500
Target: $2,000
Units: 1 contract
What happens:
You see a SELL label on a red candle
Entry line at 78.50
TP line at 77.50 (1.00 lower = $1,000 profit)
SL line at 79.00 (0.50 higher = $500 loss)
Risk/Reward: 1:2 ✅
Trade Result:
Price drops to 77.50 → Label shows ✓ = WIN
Table updates: Wins increases by 1, Win% increases
Example 3: E-mini S&P (ES) Day Trading
Setup:
Asset: Equity Futures → ES
Stop Loss: $250
Target: $1,000
Units: 6 contracts
Swap Length: 5 (default)
Enable FVG: ON
Morning Session:
See BUY at 5860.25 (swing break)
Hit TP at 5861.08 = WIN ✓
Table shows: Total 1, Buy 1, Win 1, W% 100%
See SELL at 5861.50 (FVG entry)
Hit SL at 5860.67 = LOSS ✗
Table shows: Total 2, Sell 1, Win 1, L% 50%
By end of day: 4 wins, 1 loss, 80% win rate
Troubleshooting
Issue 1: No signals appearing
Solution:
Check if both Show Bracket is ON
Check if Enable FVG Entry is ON
Try changing Swing Length (lower = more signals)
Ensure you're on a 1-hour or higher timeframe
Check chart has enough data (scroll left to see history)
Issue 2: Signals appear but no entry lines
Solution:
Confirm Show Bracket is toggled ON
Check Stop Loss ()andTarget() and Target (
)andTarget() are reasonable amounts
Ensure your Units value is not 0
Try refreshing the chart
Issue 3: Asset not recognized
Solution:
Check spelling of symbol (ES, not E-S)
Verify asset is in the supported list
Check you're in the correct category
Try closing and reopening the chart
Issue 4: Wrong stop loss/target levels
Solution:
Verify correct asset is selected
Check Units setting matches your position size
Verify Stop Loss ($) and Target ($) amounts
Look at Asset Info in table to confirm tick size
Manually calculate: SL $ ÷ (Units × Point Value) = Points
Issue 5: Statistics table not showing
Solution:
Toggle Show Statistics OFF then back ON
Try changing Table Position
Refresh the chart
Check that Show Table is enabled in settings
Issue 6: Indicator acting "heavy" or laggy
Solution:
Turn off Show Swing Structure if not needed
Turn off Show Bracket if reviewing historical trades
Reduce chart's data window (don't load entire years)
Refresh the chart
Pro Tips 🚀
Tip 1: Start with Micro Futures
Micro contracts (MES, MNQ, MCL) have lower cost
Perfect for learning the strategy
Same quality signals, smaller risk
Tip 2: Trade During Peak Hours
Equity Futures: 9:30-16:00 ET (Regular session)
Energy: 18:00-16:00 CT (After hours active)
Metals: 18:00-17:00 CT (Most liquid)
Currencies: 5:00 PM - 4:00 PM ET (24-5 market)
Tip 3: Combine Timeframes
Look for entry on 1-hour chart
Confirm on 15-minute chart
Execute on 5-minute breakout
More confluence = higher probability
Tip 4: Track Your Trades
Keep notes on WIN/LOSS trades
Identify patterns in your losses
Adjust settings based on performance
Use Win% table to monitor improvement
Tip 5: Risk Management First
Never risk more than 2% of account per trade
Respect your stop loss (don't move it)
Take profits when levels are hit
Be patient for high-probability setups
Tip 6: Adjust for Market Conditions
Trending markets: Increase Swing Length (6-8)
Choppy markets: Decrease Swing Length (2-4)
Low volatility: Reduce Stop Loss $
High volatility: Increase Target $
Quick Reference Card
────────────────────────────────────────────────────
SMC KILLER QUICK START ─────────────────────────────────────────────────────
│ 1. Select Asset Category & Symbol
│ 2. Set Units (contracts)
│ 3. Set Stop Loss ($) - your max risk
│ 4. Set Target ($) - your profit goal
│ 5. Wait for BUY (green) or SELL (red) signal
│ 6. Place entry at the entry line
│ 7. Place stop at the red/orange line
│ 8. Place take-profit at the lime/magenta line
│ 9. Close trade when line closes (✓ or ✗)
│ 10. Review statistics and adjust next trade
└─────────────────────────────────────────────────────
BUY Signal = Break Higher OR Fill Gap = LONG
SELL Signal = Break Lower OR Fill Gap = SHORT
Green candles = Uptrend
Orange candles = Downtrend
✓ = Win (took profit)
✗ = Loss (hit stop)
Support & Updates
Check settings are correct for your asset
Ensure adequate chart data is loaded
Test on demo account first
Start with smallest position size
Track performance over 20+ trades
Skrip dilindungi
Skrip ini diterbitkan sebagai sumber tertutup. Akan tetapi, anda boleh menggunakannya secara bebas dan tanpa apa-apa had – ketahui lebih di sini.
Penafian
Maklumat dan penerbitan adalah tidak bertujuan, dan tidak membentuk, nasihat atau cadangan kewangan, pelaburan, dagangan atau jenis lain yang diberikan atau disahkan oleh TradingView. Baca lebih dalam Terma Penggunaan.