OPEN-SOURCE SCRIPT
Support & Resistance with RSI Breakouts
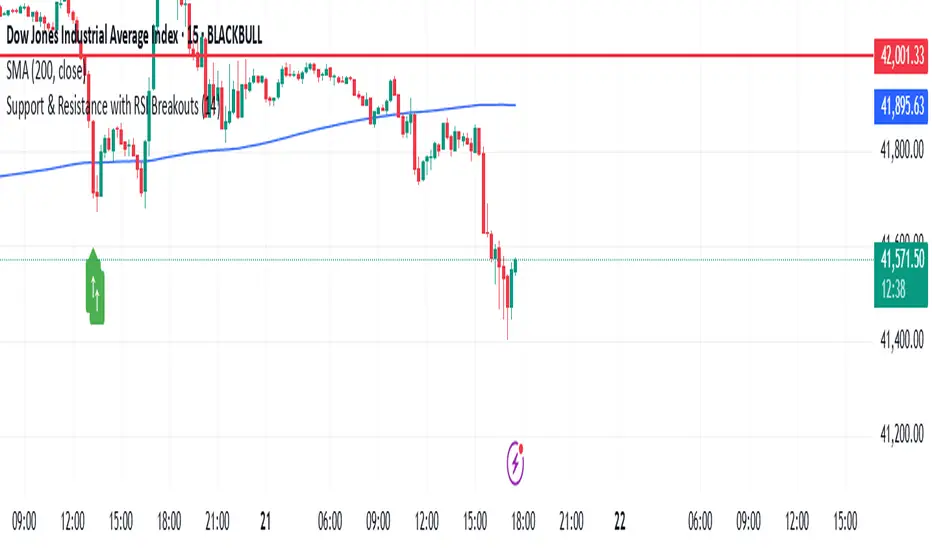
The script is a TradingView Pine Script (v5) indicator that identifies support and resistance levels using RSI (Relative Strength Index) breakouts. Here’s a breakdown of what it does:
Features:
RSI Calculation:
The script calculates the 14-period RSI (default) using the closing price.
The user can modify the RSI period through an input setting.
Buy and Sell Signals:
A buy signal is triggered when RSI drops below 20 (indicating oversold conditions).
A sell signal is triggered when RSI rises above 80 (indicating overbought conditions).
Visual Representation:
Buy signals are marked with a green upward arrow (↑) below the price bars.
Sell signals are marked with a red downward arrow (↓) above the price bars.
The arrows help traders easily spot potential trade opportunities.
Usage:
This script is useful for traders looking to buy at oversold conditions and sell at overbought conditions based on RSI.
It works best when combined with other indicators or price action strategies to confirm signals.
Skrip sumber terbuka
Dalam semangat TradingView sebenar, pencipta skrip ini telah menjadikannya sumber terbuka, jadi pedagang boleh menilai dan mengesahkan kefungsiannya. Terima kasih kepada penulis! Walaupuan anda boleh menggunakan secara percuma, ingat bahawa penerbitan semula kod ini tertakluk kepada Peraturan Dalaman.
Penafian
Maklumat dan penerbitan adalah tidak bertujuan, dan tidak membentuk, nasihat atau cadangan kewangan, pelaburan, dagangan atau jenis lain yang diberikan atau disahkan oleh TradingView. Baca lebih dalam Terma Penggunaan.