PROTECTED SOURCE SCRIPT
ZTCRYPTOLAB - Oscillator Matrix
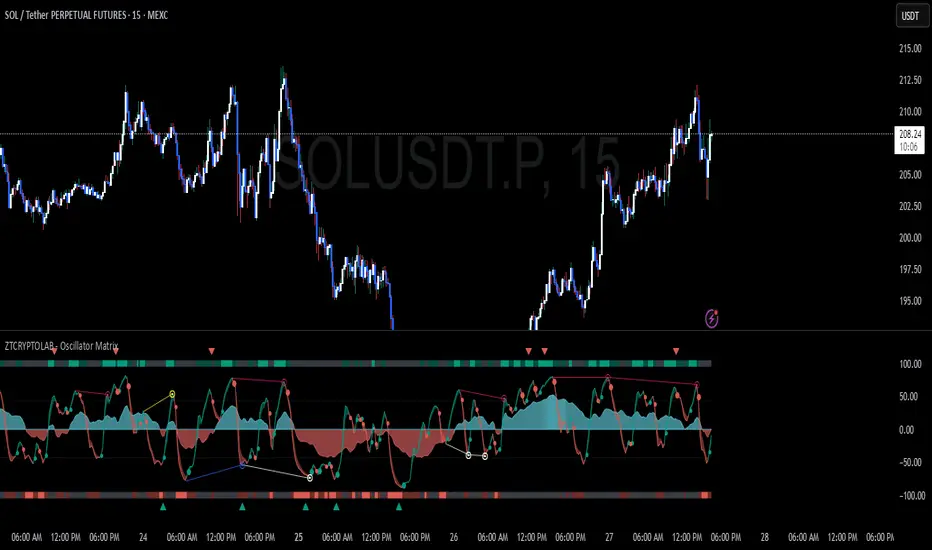
ZTCRYPTOLAB – Oscillator Matrix is a momentum and market-strength oscillator designed to help traders identify overbought/oversold conditions, divergences, and potential reversal points with enhanced visual clarity.
🔹 Core Logic
This oscillator blends multiple momentum measures into a single framework:
RSI (Relative Strength Index) for directional momentum.
MFI (Money Flow Index) with dual fast/slow lengths for flow balance.
Stochastic smoothing for short-term acceleration.
These are normalized, transformed, and combined into two smoothed signal lines (fast vs. slow average) that form the backbone of the oscillator.
🔹 Visual Components
Histogram (Money Flow Cloud): Displays directional flow. As price pushes further into overbought/oversold zones, the histogram cloud brightens in intensity, making strong conditions stand out.
Signal Lines: Two smoothed oscillator curves, with crossovers and relative position highlighting momentum shifts.
Reversal Dots: Circles appear when the oscillator detects exhaustion in OB/OS territory, giving early reversal signals.
Status Line Bands: A confluence score (0–3) plots colored bands at the top/bottom of the panel, showing the current strength of bullish or bearish conditions.
🔹 Divergence Engine
The script includes a custom divergence detector that compares oscillator pivots with price pivots:
Regular divergences highlight momentum weakening against price extremes.
Hidden divergences signal continuation potential when momentum recovers faster than price.
The engine applies strict pivot distance rules and checks for line-cross violations, which reduces noise and false signals.
🔹 Take-Profit Signals
TP markers appear when the oscillator forms exhaustion pivots beyond ±50 zones, helping traders spot where momentum may fade after a run.
🔹 Alerts & Automation
All major events can be linked to TradingView alerts, including:
Signal line crossovers
Reversal dots
Divergences (regular + hidden)
Take-profit signals
Confluence score changes
Additionally, a Custom Alert Builder lets traders define multi-step conditions (e.g., “Money Flow cross + Reversal Dot + Divergence”) and trigger alerts only when sequences are met.
🔹 How to Use
Trend Confirmation: Use the histogram and signal lines to confirm market bias.
Reversals: Watch for dots + divergences near extremes.
Exits / Scaling: TP markers and bright clouds highlight when momentum is stretched.
Alerts: Configure the builder to align with your trading plan (scalping, swing, trend-following).
Skrip dilindungi
Skrip ini diterbitkan sebagai sumber tertutup. Akan tetapi, anda boleh menggunakannya dengan percuma dan tanpa had – ketahui lebih lanjut di sini.
Penafian
Maklumat dan penerbitan adalah tidak dimaksudkan untuk menjadi, dan tidak membentuk, nasihat untuk kewangan, pelaburan, perdagangan dan jenis-jenis lain atau cadangan yang dibekalkan atau disahkan oleh TradingView. Baca dengan lebih lanjut di Terma Penggunaan.