OPEN-SOURCE SCRIPT
Telah dikemas kini Yield Curve Inversion Indicator
Introduction
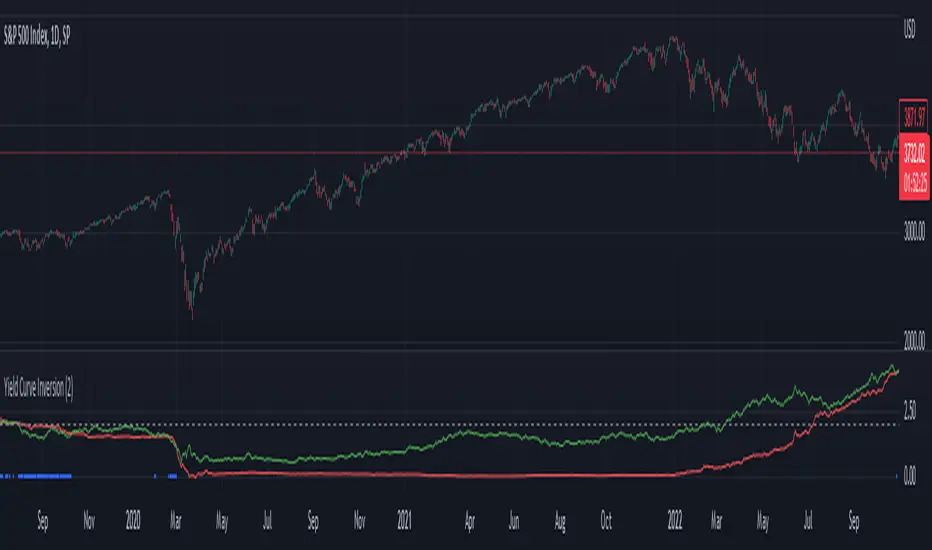
The last time (as of this publishing) that this indicator detected an inverted interest rate yield curve was on February 20th, 2020 at 12:30pm EST, the afternoon before the S&P500 began one of its largest crashes in US history. The vast majority of major economic recessions since the 1950's have been preceded by an interest rate yield curve inversion. I created this indicator originally as an input to study the impacts of more conservative risk management on quantitative trading strategies following a yield curve inversion event. It is being shared with the community as a quick indicator to check to see the comparative status of short term and long term interest rates, and as an indicator where you can easily check to see if we are experiencing an inverted yield curve in real-time.
Background of the significance of an inverted yield curve:
"What an inverted yield curve really means is that most investors believe that short-term interest rates are going to fall sharply at some point in the future. As a practical matter, recessions usually cause interest rates to fall. Historically, inversions of the yield curve have preceded recessions in the U.S. Due to this historical correlation, the yield curve is often seen as a way to predict the turning points of the business cycle. When the yield curve inverts, short-term interest rates become higher than long-term rates. This type of yield curve is the rarest of the three main curve types and is considered to be a predictor of economic recession. Because of the rarity of yield curve inversions, they typically draw attention from all parts of the financial world." (investopedia.com/terms/i/invertedyieldcurve.asp)
Settings and Usage
This indicator pulls in pricing data from tickers that represent short term and long term interest rates, and compares them. The red line represents short term interest rates, and the green line represents long term interest rates. When the red line is above the green line, it indicates that we are experiencing a yield curve inversion. Small blue crosses also appear on the bottom of the indicator during an inversion to further highlight the event visually. This indicator pulls in the same information on the same two interest rate tickers regardless of what chart it is applied to.
Other Thoughts
This script uses the f_secureSecurity function as a best practice. For those that are versed in PineScript, code from this indicator could be adapted to be applied to an interest rate chart that allows custom alerts to be created the moment that there is an inverted interest rate yield curve.
Nota Keluaran
Notes updateNota Keluaran
Notes updateNota Keluaran
Indicator Update: We recently started to experience a yield curve inversion, and it prompted me to update the indicator built for it. The script description has more details on the relevance of this event. This new version of the indicator is converted to PineScript V5, adds additional inputs, pulls in additional yields and provides additional data sources you can select that have more history. Skrip sumber terbuka
Dalam semangat TradingView sebenar, pencipta skrip ini telah menjadikannya sumber terbuka, jadi pedagang boleh menilai dan mengesahkan kefungsiannya. Terima kasih kepada penulis! Walaupuan anda boleh menggunakan secara percuma, ingat bahawa penerbitan semula kod ini tertakluk kepada Peraturan Dalaman.
Want to build custom alerts and custom strategies? Interested in automated trading?
Hire me to code or automate your trading strategy, or schedule a free consultation at:
TradeAutomation.net
Hire me to code or automate your trading strategy, or schedule a free consultation at:
TradeAutomation.net
Penafian
Maklumat dan penerbitan adalah tidak bertujuan, dan tidak membentuk, nasihat atau cadangan kewangan, pelaburan, dagangan atau jenis lain yang diberikan atau disahkan oleh TradingView. Baca lebih dalam Terma Penggunaan.
Skrip sumber terbuka
Dalam semangat TradingView sebenar, pencipta skrip ini telah menjadikannya sumber terbuka, jadi pedagang boleh menilai dan mengesahkan kefungsiannya. Terima kasih kepada penulis! Walaupuan anda boleh menggunakan secara percuma, ingat bahawa penerbitan semula kod ini tertakluk kepada Peraturan Dalaman.
Want to build custom alerts and custom strategies? Interested in automated trading?
Hire me to code or automate your trading strategy, or schedule a free consultation at:
TradeAutomation.net
Hire me to code or automate your trading strategy, or schedule a free consultation at:
TradeAutomation.net
Penafian
Maklumat dan penerbitan adalah tidak bertujuan, dan tidak membentuk, nasihat atau cadangan kewangan, pelaburan, dagangan atau jenis lain yang diberikan atau disahkan oleh TradingView. Baca lebih dalam Terma Penggunaan.