TradeChartist Drifter
===================================================================================================================
™𝗧𝗿𝗮𝗱𝗲𝗖𝗵𝗮𝗿𝘁𝗶𝘀𝘁 𝗗𝗿𝗶𝗳𝘁𝗲𝗿 𝗨𝘀𝗲𝗿 𝗠𝗮𝗻𝘂𝗮𝗹
===================================
Concept of Drift
™TradeChartist Drifter combines concepts of Trend-based Support and Resistance, Momentum and Volatility to plot continuous Drifter Support and Resistance Walls that encloses the price action (Drift) within it (If the source price is price candle/bar based price like open,close,high,low,hl2,hl3 or ohlc4). In fact, these walls are generated by the price action (Drift) itself and helps the user see the price trend clearly as price makes higher highs/lows and lower highs/lows.
- The Drifter walls are based on the user defined lookback length which can be changed in the Lᴇɴɢᴛʜ ғᴏʀ Dʀɪғᴛᴇʀ Wᴀʟʟs input box.
- Drifter walls can be viewed or hidden by enabling or disabling 𝐒𝐡𝐨𝐰 𝐃𝐫𝐢𝐟𝐭𝐞𝐫 𝐖𝐚𝐥𝐥𝐬.
- Price Highs and Lows breaching the Drifter Walls can be viewed or hidden by enabling or disabling Sʜᴏᴡ Dʀɪғᴛᴇʀ Hɪɢʜs ᴀɴᴅ Lᴏᴡs.
- Understanding and Visualizing (Drift) is important as it helps traders see the price action clearly. Price Volatility, Trend and Momentum are dependent on the period they are analysed. In order to visualize the drift, the user must enter the number of bars lookback in the Dʀɪғᴛ Lᴏᴏᴋʙᴀᴄᴋ input box.
===================================================================================================================
Three Types of Visualizers
One of the three types of Visualizers can be selected from Vɪsᴜᴀʟɪᴢᴇʀ Tʏᴘᴇ dropdown.
- Drifter AutoFibs Visualizer is dependent on the Lᴇɴɢᴛʜ ғᴏʀ Dʀɪғᴛᴇʀ Wᴀʟʟs only as it fills the Drifter with Automatic Fibonacci Levels based on the distance between the Drifter Walls.
- Drift Strength Visualizer is dependent on the Dʀɪғᴛ Lᴏᴏᴋʙᴀᴄᴋ only as it detects the Drift Strength based on Drift length. This Visualizer detects the Bull and the Bear zones based on the lookback. This helps visualize the Trend and Momentum clearly as the zones are filled with user selected theme based Bull and Bear colours.
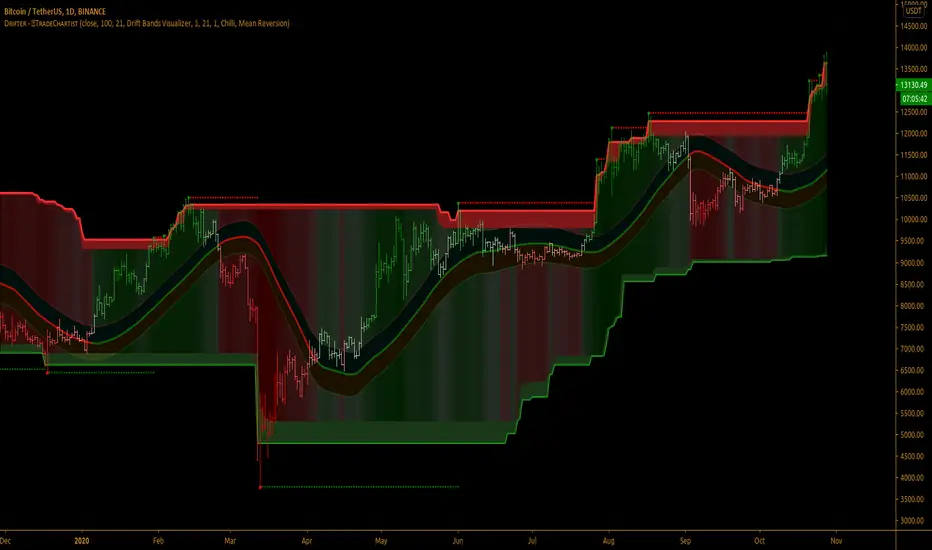
- Drift Bands Visualizer plots Drift Bands based on either Average True Range (ATR) or Standard Deviation along with the Bull or Bear Trend clearly shown using the color of the Mean or Basis line of the Drift Bands.
===================================================================================================================
╔═════════ 𝗗𝗿𝗶𝗳𝘁 𝗕𝗮𝗻𝗱𝘀 ══════════╗
Drift Bands are based on either ATR or Standard Deviation and consists of an Upper Band, a Lower Bands and a Mean or Basis Line. Drift Bands are extremely effective and highly useful in spotting the trend as the breakout from the upper or the lower band signals a change in the Drift based on the Dʀɪғᴛ Lᴏᴏᴋʙᴀᴄᴋ.
Note: The Mean or the Basis line of the Drift Bands depends only on the Dʀɪғᴛ Lᴏᴏᴋʙᴀᴄᴋ and Sᴏᴜʀᴄᴇ price. To plot Drift Bands based on external source, enable Usᴇ Sᴏᴜʀᴄᴇ Pʀɪᴄᴇ. The Width of the Bands is affected by ATR or Standard Deviation, based on the user preference.
ATR based Drift Bands
To plot ATR based Drift bands, enable 𝐀𝐓𝐑 𝐁𝐚𝐧𝐝𝐬 - Uɴᴄʜᴇᴄᴋ ғᴏʀ Sᴛᴀɴᴅᴀʀᴅ Dᴇᴠɪᴀᴛɪᴏɴ. ATR period is automatic. The ATR factor or the ATR multiplier can be changed in ATR Mᴜʟᴛɪᴘʟɪᴇʀ (ғᴏʀ ᴀᴛʀ ʙᴀsᴇᴅ ʙᴀɴᴅs (Default - 1, Min - 0.5, Max - 3). Higher ATR multiplier increases the width of the Drift Bands.
Note: In most cases, higher ATR multiplier of 2 or 3 increases Risk, but also results in increased Gains.
Standard Deviation based Drift Bands
To plot Standard Deviation bases Drift Bands, disable 𝐀𝐓𝐑 𝐁𝐚𝐧𝐝𝐬 - Uɴᴄʜᴇᴄᴋ ғᴏʀ Sᴛᴀɴᴅᴀʀᴅ Dᴇᴠɪᴀᴛɪᴏɴ. Both Sᴛᴀɴᴅᴀʀᴅ Dᴇᴠɪᴀᴛɪᴏɴ Lᴇɴɢᴛʜ (Default - 55, Min - 13) and Sᴛᴀɴᴅᴀʀᴅ Dᴇᴠɪᴀᴛɪᴏɴ Mᴜʟᴛɪᴘʟɪᴇʀ (Default - 1, Min - 0.236, Max - 2) affect the width of the Bands. Higher Standard Deviation Multiplier increases the Volatility of the Drift Bands.
Note: In most cases, higher Standard Deviation multiplier increases Risk, but also results in increased Gains.
Tip: To plot Bull and Bear Drift Zones, enable 𝐃𝐫𝐢𝐟𝐭 𝐙𝐨𝐧𝐞𝐬 𝐁𝐚𝐜𝐤𝐠𝐫𝐨𝐮𝐧𝐝 𝐅𝐢𝐥𝐥 and this can be used as Trade zones as this will be in sync with the trend colour of Mean line of the Drift Bands.
===================================================================================================================
╔═══════ 𝗗𝗿𝗶𝗳𝘁𝗲𝗿 𝗔𝗲𝘀𝘁𝗵𝗲𝘁𝗶𝗰𝘀 ═══════╗
- There are two themes (Chilli and Flame) to choose from for the colour schemes of Drifter under 𝗗𝗿𝗶𝗳𝘁𝗲𝗿 𝗧𝗵𝗲𝗺𝗲 dropdown.
- Dʀɪғᴛᴇʀ Bᴀᴄᴋɢʀᴏᴜɴᴅ Fɪʟʟ plots Bull and Bear strength based background fill between the Drifter walls. This is disabled for Drifter AutoFibs Visualizer.
- There are two types of background fills namely, Mean Reversion and Trend Following and can be selected from Bᴀᴄᴋɢʀᴏᴜɴᴅ Fɪʟʟ Tʏᴘᴇ dropdown.
- Enabling Dʀɪғᴛᴇʀ Cᴏʟᴏᴜʀ Bᴀʀs paints the price bars with the Drifter background fill.
Note: Trend Following fill is dependent on Dʀɪғᴛ Lᴏᴏᴋʙᴀᴄᴋ.
===================================================================================================================
Alerts
Alerts can be created for Long and Short entries by using Once Per Bar Close as Alert Frequency. Entries are generated on Real time bars based on Drift Bands Breakout conditions. It is recommended to wait for bar close before taking a position based on Drift Bands Trade Entries.
The indicator does not repaint and can be confidently used for alerts and trade entries without worrying about signals disappearing.
™TradeChartist Drifter can also be connected to ™TradeChartist Plug and Trade using 𝗗𝗿𝗶𝗳𝘁𝗲𝗿 𝗧𝗿𝗲𝗻𝗱 𝗜𝗱𝗲𝗻𝘁𝗶𝗳𝗶𝗲𝗿 as Oscillatory Signal to generate entries along with Targets, Stop Loss plots etc. Target and Stop Loss alerts can be created using Plug and Trade's Alerts system.
===================================================================================================================
There are several combinations of settings that can be tested on the security traded based on timeframe and risk/reward expectations. The indicator can be used for trade entries with various Drift Bands settings. Following are a few examples using the Drifter.
===================================================================================================================
Example Charts
1. SPX 1hr chart using Drifter AutoFibs Visualizer based on 100 period lookback for Drifter Walls.
2. SPX 1hr chart using Drift Strength Visualizer based on 100 period Drift Lookback.
3. SPX 1hr chart using 100 period ATR (Multiplier - 1) based Drift Bands Visualizer with Drift Zones Background Fill.
4. SPX 1hr chart using 50 period ATR (Multiplier - 1) based Drift Bands Visualizer with Drift Zones Background Fill.
5. SPX 1hr chart using 50 period Standard Deviation (Length - 21, Multiplier - 2) based Drift Bands Visualizer with Drift Zones Background Fill.
6. EUR-USD 1hr chart using 34 period ATR (Multiplier - 3) based Drift Bands Visualizer with Drift Zones Background Fill.
7. BTC-USD 5m chart using 34 period ATR (Multiplier - 3) based Drift Bands Visualizer connected to ™TradeChartist Intensity Equilibrium Line.
8. BTC-USD 5m chart using 34 period ATR (Multiplier - 3) based Drift Bands Visualizer connected to ™TradeChartist Intensity Equilibrium Line + Connected to ™TradeChartist Plug and Trade
===================================================================================================================
Best Practice: Test with different settings first using Paper Trades before trading with real money
===================================================================================================================
This is not a free to use indicator. Get in touch with me (PM me directly if you would like trial access to test the indicator)
Premium Scripts - Trial access and Information
Trial access offered on all Premium scripts.
PM me directly to request trial access to the scripts or for more information.
===================================================================================================================
Skrip jemputan sahaja
Hanya pengguna disahkan oleh penulis boleh mengakses skrip ini. Anda perlu memohon dan mendapatkan kebenaran untuk menggunakannya. Keizinan selalunya diberikan selepas pembayaran. Untuk lebih butiran, ikuti arahan penulis di bawah atau hubungi TradeChartist secara terus.
TradingView TIDAK menyarankan pembayaran atau penggunaan skrip kecuali anda mempercayai sepenuhnya penulis dan memahami bagaimana ia berfungsi. Anda juga boleh menjumpai alternatif sumber terbuka dan percuma yang lain di dalam skrip komuniti kami.
Arahan penulis
Telegram - @Trade_Chartist
Free Scripts - bit.ly/Free-Scripts
Penafian
Skrip jemputan sahaja
Hanya pengguna disahkan oleh penulis boleh mengakses skrip ini. Anda perlu memohon dan mendapatkan kebenaran untuk menggunakannya. Keizinan selalunya diberikan selepas pembayaran. Untuk lebih butiran, ikuti arahan penulis di bawah atau hubungi TradeChartist secara terus.
TradingView TIDAK menyarankan pembayaran atau penggunaan skrip kecuali anda mempercayai sepenuhnya penulis dan memahami bagaimana ia berfungsi. Anda juga boleh menjumpai alternatif sumber terbuka dan percuma yang lain di dalam skrip komuniti kami.
Arahan penulis
Telegram - @Trade_Chartist
Free Scripts - bit.ly/Free-Scripts