PROTECTED SOURCE SCRIPT
💎💎💎 We are the Masters- by edegrano-Donna-Leah 2
How to Use the "💎💎💎 We are the Masters" Script
1. Set Your Timeframes
EMA Timeframes (emaTF1, emaTF2, emaTF3):
Choose 3 different chart timeframes on which you want to analyze the EMA bias. These timeframes will determine how the script evaluates the market trend via EMAs.
Trendline Timeframes (tf1, tf2, tf3):
Choose 3 timeframes for the linear regression trendlines. These smooth out price action and indicate the trend slope.
2. Set Linear Regression Length (regLen)
This controls the length (number of bars) the linear regression trendline uses to calculate the trend.
Smaller values make the trendline more sensitive; higher values smooth out noise but react slower.
3. Interpret the Output
EMA Bias per Timeframe:
Bullish if EMA 50 > EMA 200 on that timeframe.
Bearish if EMA 50 < EMA 200.
Trendline Slope per Timeframe:
Bullish if current regression value > previous regression value (price is trending up).
Bearish if current regression value ≤ previous regression value.
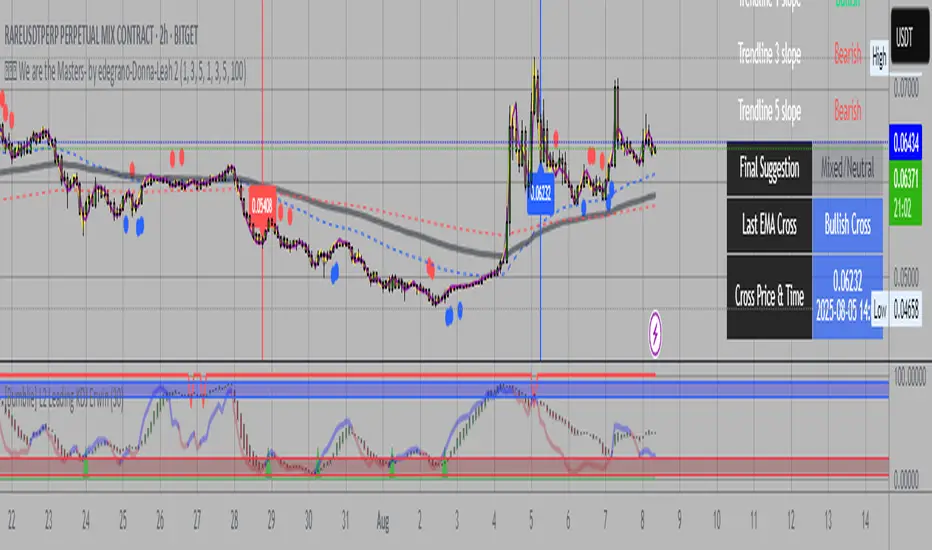
Special Buy Signal:
When all 3 EMA biases are bullish AND all 3 trendline slopes are bullish → Strong Buy Signal (blue dot below bar).
Special Sell Signal:
When all 3 EMA biases are bearish AND all 3 trendline slopes are bearish → Strong Sell Signal (red dot above bar).
EMA Crosses:
The script plots vertical lines and labels on the current timeframe when EMA 50 crosses above (bullish) or below (bearish) EMA 200.
Information Table:
Shows EMA bias and trendline slope status for all timeframes, last EMA cross info, and final overall suggestion.
4. How to Use in Trading
Confirm Trend: Use the EMA bias and trendline slope confluences to confirm the overall trend across multiple timeframes.
Trade Entry: Consider entering long when the special buy signal appears; enter short when the special sell signal appears.
EMA Crosses: Use crosses as secondary confirmation or to detect early momentum shifts.
Trendline Slope: Helps confirm if the price is gaining or losing strength on different timeframes.
Monitor Table: Quickly glance to understand current market bias and confluence.
Suggested Parameters for Different Trading Styles
Style EMA Timeframes Trendline Timeframes Linear Regression Length (regLen)
Scalping 1 min, 3 min, 5 min 1 min, 3 min, 5 min 15 - 20 (responsive, fast)
Day Trading 5 min, 15 min, 30 min 5 min, 15 min, 30 min 20 - 30 (balanced responsiveness)
Swing Trading 1 hr, 4 hr, Daily 1 hr, 4 hr, Daily 30 - 50 (smoother, slower trend)
Position Trading 4 hr, Daily, Weekly 4 hr, Daily, Weekly 50 - 100 (very smooth)
Tips
When using short timeframes, keep the regression length smaller for quicker reaction to price changes.
For longer timeframes, increase regression length to reduce noise and false signals.
Use this script alongside volume or other indicators to improve entry quality.
Avoid trading against the overall confluence bias (e.g., don’t enter longs if final suggestion is “Strong Bearish”).
1. Set Your Timeframes
EMA Timeframes (emaTF1, emaTF2, emaTF3):
Choose 3 different chart timeframes on which you want to analyze the EMA bias. These timeframes will determine how the script evaluates the market trend via EMAs.
Trendline Timeframes (tf1, tf2, tf3):
Choose 3 timeframes for the linear regression trendlines. These smooth out price action and indicate the trend slope.
2. Set Linear Regression Length (regLen)
This controls the length (number of bars) the linear regression trendline uses to calculate the trend.
Smaller values make the trendline more sensitive; higher values smooth out noise but react slower.
3. Interpret the Output
EMA Bias per Timeframe:
Bullish if EMA 50 > EMA 200 on that timeframe.
Bearish if EMA 50 < EMA 200.
Trendline Slope per Timeframe:
Bullish if current regression value > previous regression value (price is trending up).
Bearish if current regression value ≤ previous regression value.
Special Buy Signal:
When all 3 EMA biases are bullish AND all 3 trendline slopes are bullish → Strong Buy Signal (blue dot below bar).
Special Sell Signal:
When all 3 EMA biases are bearish AND all 3 trendline slopes are bearish → Strong Sell Signal (red dot above bar).
EMA Crosses:
The script plots vertical lines and labels on the current timeframe when EMA 50 crosses above (bullish) or below (bearish) EMA 200.
Information Table:
Shows EMA bias and trendline slope status for all timeframes, last EMA cross info, and final overall suggestion.
4. How to Use in Trading
Confirm Trend: Use the EMA bias and trendline slope confluences to confirm the overall trend across multiple timeframes.
Trade Entry: Consider entering long when the special buy signal appears; enter short when the special sell signal appears.
EMA Crosses: Use crosses as secondary confirmation or to detect early momentum shifts.
Trendline Slope: Helps confirm if the price is gaining or losing strength on different timeframes.
Monitor Table: Quickly glance to understand current market bias and confluence.
Suggested Parameters for Different Trading Styles
Style EMA Timeframes Trendline Timeframes Linear Regression Length (regLen)
Scalping 1 min, 3 min, 5 min 1 min, 3 min, 5 min 15 - 20 (responsive, fast)
Day Trading 5 min, 15 min, 30 min 5 min, 15 min, 30 min 20 - 30 (balanced responsiveness)
Swing Trading 1 hr, 4 hr, Daily 1 hr, 4 hr, Daily 30 - 50 (smoother, slower trend)
Position Trading 4 hr, Daily, Weekly 4 hr, Daily, Weekly 50 - 100 (very smooth)
Tips
When using short timeframes, keep the regression length smaller for quicker reaction to price changes.
For longer timeframes, increase regression length to reduce noise and false signals.
Use this script alongside volume or other indicators to improve entry quality.
Avoid trading against the overall confluence bias (e.g., don’t enter longs if final suggestion is “Strong Bearish”).
Skrip dilindungi
Skrip ini diterbitkan sebagai sumber tertutup. Akan tetapi, anda boleh menggunakannya secara bebas dan tanpa apa-apa had – ketahui lebih di sini.
Penafian
Maklumat dan penerbitan adalah tidak bertujuan, dan tidak membentuk, nasihat atau cadangan kewangan, pelaburan, dagangan atau jenis lain yang diberikan atau disahkan oleh TradingView. Baca lebih dalam Terma Penggunaan.