OPEN-SOURCE SCRIPT
Telah dikemas kini [blackcat] L1 Leavitt Convolution Slope
Level 1
Background
First of all, I would like to thank ashok1961 for his donation. Second, he made an interesting request: can I write a pine version of LeavittConvSlope.
Function
The indicator uses linear regression of price data to derive slope and acceleration information that helps traders spot trends and turning points. After trying this metric myself, I think it works better with the divergence detector. So I added it. Let me know what you think of this divergence detector.
Remarks
Feedbacks are appreciated.
Nota Keluaran
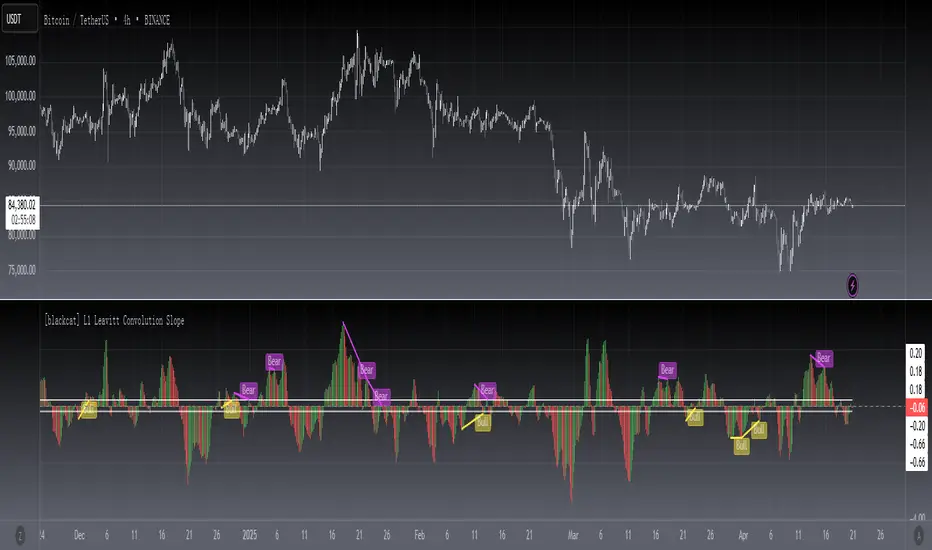
OVERVIEWThe [blackcat] L1 Leavitt Convolution Slope indicator is designed to help traders identify potential trend reversals by analyzing the slope of a custom convolution applied to price data. This script calculates various projections and slopes using linear regression techniques, providing insights into market momentum and potential turning points 📉↗️.
FEATURES
Calculates Leavitt Projection, Convolution, and Linear Regression Slope:
Price Data: Selectable source for price calculations.
Convolution Length: Adjustable parameter for convolution calculation.
Uncertainty Threshold: Customizable threshold for uncertainty bands.
Plots the Leavitt Convolution Slope with dynamic colors:
Green when the slope increases.
Red when the slope decreases.
Gray when there is no significant change.
Displays positive and negative uncertainty thresholds as reference lines ⚠️
Identifies and plots divergence patterns:
Regular Bullish and Hidden Bullish divergences.
Regular Bearish and Hidden Bearish divergences.
Provides clear visual labels for each identified pattern 🏷️
HOW TO USE
Add the indicator to your TradingView chart by selecting it from the indicators list.
Adjust the input parameters (Price Data, Convolution Length, Uncertainty Threshold) to fit your trading strategy ⚙️.
Monitor the plotted Leavitt Convolution Slope for changes in direction.
Observe the divergence patterns on the chart for potential trade signals.
Use the uncertainty thresholds as additional context for decision-making.
LIMITATIONS
The indicator may generate false signals in highly volatile or ranging markets 🌪️.
Users should combine this indicator with other forms of analysis for more reliable trading decisions.
The effectiveness of the indicator may vary depending on the asset and timeframe being analyzed.
NOTES
Ensure that you have sufficient historical data available for accurate calculations.
Test the indicator thoroughly on demo accounts before applying it to live trading 🔍.
Customize the appearance and parameters as needed to fit your trading strategy.
Skrip sumber terbuka
Dalam semangat TradingView sebenar, pencipta skrip ini telah menjadikannya sumber terbuka, jadi pedagang boleh menilai dan mengesahkan kefungsiannya. Terima kasih kepada penulis! Walaupuan anda boleh menggunakan secara percuma, ingat bahawa penerbitan semula kod ini tertakluk kepada Peraturan Dalaman.
Avoid losing contact!Don't miss out! The first and most important thing to do is to join my Discord chat now! Click here to start your adventure: discord.com/invite/ZTGpQJq 防止失联,请立即行动,加入本猫聊天群: discord.com/invite/ZTGpQJq
Penafian
Maklumat dan penerbitan adalah tidak bertujuan, dan tidak membentuk, nasihat atau cadangan kewangan, pelaburan, dagangan atau jenis lain yang diberikan atau disahkan oleh TradingView. Baca lebih dalam Terma Penggunaan.