OPEN-SOURCE SCRIPT
Inside Bar + Harami Combo
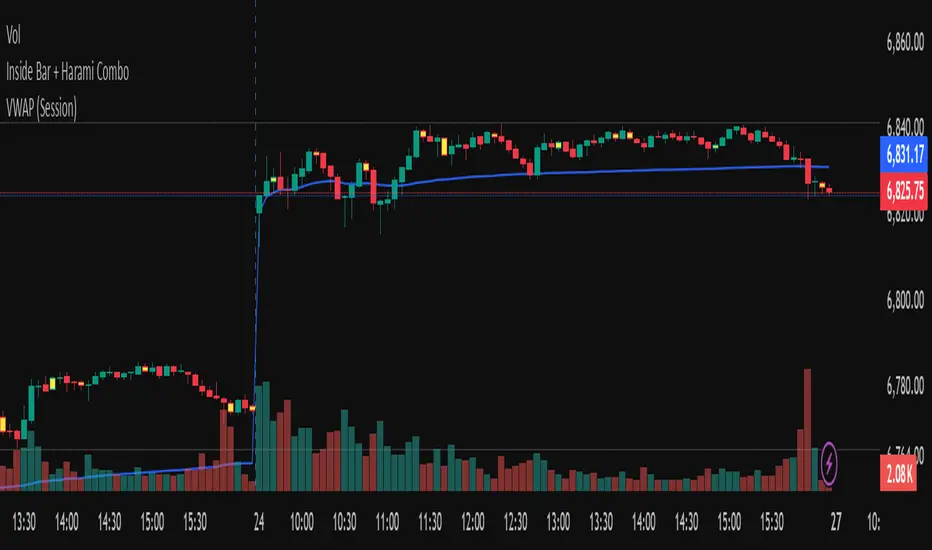
This indicator visually highlights Inside Bars, Outside Bars, and Harami candlestick patterns directly on your chart using clean color-coded candles — no labels, no shapes, just visual clarity.
It helps traders quickly identify potential reversal and continuation setups by coloring candles according to the detected pattern type.
🔍 Patterns Detected
🟨 Inside Bar — Current candle’s range is completely inside the previous candle’s range.
Often signals price contraction before a breakout.
💗 Outside Bar — Current candle’s high and low exceed the previous candle’s range.
Indicates volatility expansion and possible trend continuation.
🟩 Bullish Harami — A small bullish candle within the body of a prior bearish candle.
Suggests potential reversal to the upside.
🟥 Bearish Harami — A small bearish candle within the body of a prior bullish candle.
Suggests potential reversal to the downside.
⚙️ Features
Customizable colors for each pattern type.
Simple overlay visualization — no shapes, no labels, just colored candles.
Harami colors automatically override Inside/Outside colors when both occur on the same bar.
Lightweight logic for smooth performance on any timeframe or symbol.
💡 How to Use
Apply the indicator to your chart.
Configure colors in the settings panel if desired.
Watch for highlighted candles:
Inside Bars often precede breakouts.
Harami patterns can mark reversal zones.
Combine with trend tools (like moving averages) to confirm setups.
⚠️ Note
This indicator is for visual pattern detection and educational use only.
Always combine candlestick signals with broader technical or market context before trading decisions.
Skrip sumber terbuka
Dalam semangat TradingView sebenar, pencipta skrip ini telah menjadikannya sumber terbuka, jadi pedagang boleh menilai dan mengesahkan kefungsiannya. Terima kasih kepada penulis! Walaupuan anda boleh menggunakan secara percuma, ingat bahawa penerbitan semula kod ini tertakluk kepada Peraturan Dalaman.
Penafian
Maklumat dan penerbitan adalah tidak bertujuan, dan tidak membentuk, nasihat atau cadangan kewangan, pelaburan, dagangan atau jenis lain yang diberikan atau disahkan oleh TradingView. Baca lebih dalam Terma Penggunaan.