OPEN-SOURCE SCRIPT
Telah dikemas kini Statistical Footprint
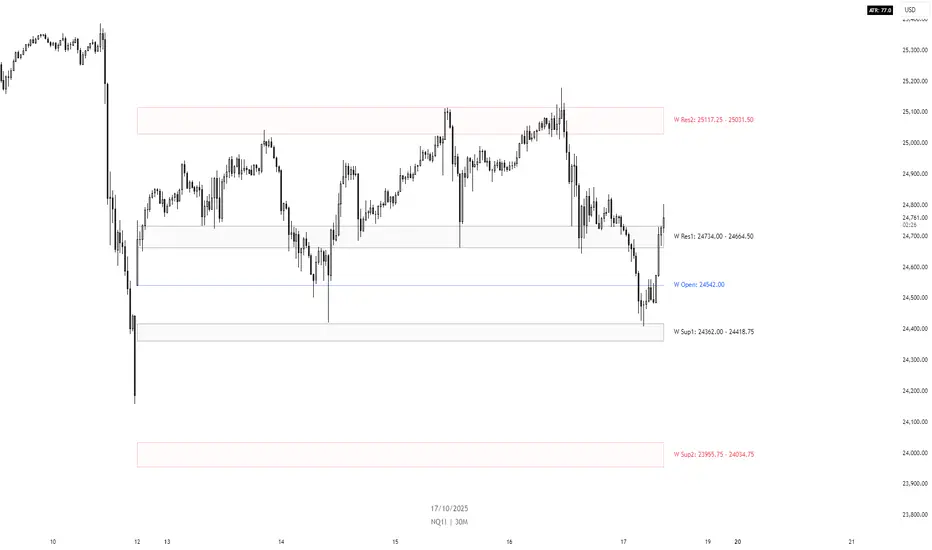
Statistical Footprint - Behavioral Support & Resistance
This indicator identifies key price levels based on actual market behavior rather than traditional pivot calculations. It analyzes how bulls and bears have historically moved price from session opens, creating statistical zones where future reactions are most likely.
The concept is simple: track how far bullish candles typically push above the open versus how far bearish candles drop below it. These patterns reveal the market's behavioral "footprint" - showing where momentum typically stalls and reverses.
Key Features:
- Separate analysis for daily and weekly timeframes
- Smart zone merging when levels cluster together (within 5 points)
- Uses both mean and median calculations for more robust levels
- XGBoost-optimized lookback periods for maximum statistical significance
- Clean zone-only display focused on actionable price areas
How it Works:
The code separates bullish and bearish sessions, measuring their typical range extensions from the open. It then projects these statistical ranges forward from current session opens, creating "behavioral zones" where the market has historically shown consistent reactions.
When daily and weekly levels align closely, they merge into combined zones with enhanced significance. Labels show both the mean and median values when they differ meaningfully.
Best Used For:
- Identifying high-probability reversal zones
- Setting profit targets based on historical behavior
- Understanding market sentiment shifts at key levels
- Confluence analysis between different timeframes
The lookback periods have been optimized using machine learning to find the most predictive historical sample sizes for current market conditions.
Nota Keluaran
Update: Updated the daily and weekly values to be more accurate.
Nota Keluaran
Updated the name to Fancy Zones.Nota Keluaran
Updated name.Nota Keluaran
Updated to version 3.0.This updates includes a few logic updates, visual updates, and cleanup.
Skrip sumber terbuka
Dalam semangat TradingView sebenar, pencipta skrip ini telah menjadikannya sumber terbuka, jadi pedagang boleh menilai dan mengesahkan kefungsiannya. Terima kasih kepada penulis! Walaupuan anda boleh menggunakan secara percuma, ingat bahawa penerbitan semula kod ini tertakluk kepada Peraturan Dalaman.
Penafian
Maklumat dan penerbitan adalah tidak bertujuan, dan tidak membentuk, nasihat atau cadangan kewangan, pelaburan, dagangan atau jenis lain yang diberikan atau disahkan oleh TradingView. Baca lebih dalam Terma Penggunaan.