OPEN-SOURCE SCRIPT
Telah dikemas kini Intraday Super Sectors
Motivated by Cody to finish what I'd started ...
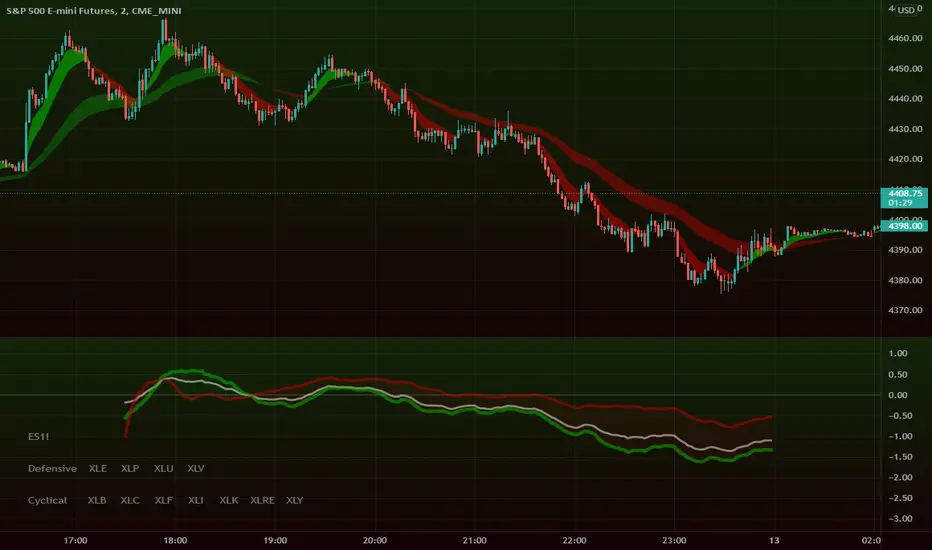
This indicator plots the two 'Super Sectors' (Cyclical and Defensive) intraday change, viz-a-viz SPX price
* for convenience, it uses the ETF's, rather than the actual sectors. This might make it 0.0001% inaccurate.
For reference:
Defensive Sectors:
XLE Energy (not always considered a true defensive sector, but I've thrown it in here for balance)
XLP Consumer Staples
XLU Utilities
XLV Health Care
Cyclical Sectors:
XLB Materials
XLC Communication Services
XLF Financials
XLI Industrials
XLK Information Technology
XLRE Real Estate
XLY Consumer Discretionary
Why the (soft) red/green cloud?
Well, the theory says is that if the Cyclical Sector is down, while the Defensive Sector is up, this isn't exactly bullish (so a soft red cloud), or if Defensive Stocks are down, while Cyclical Stocks are up, this is perhaps bullish.
Of course, if SPX is down 10%, with Defensive Stocks down 20%, and Cyclical Stocks down 5%, you might get a green cloud, but it ain't exactly a bullish sign
Nota Keluaran
New Features!* User can choose whether a sector is 'Cyclical' or 'Defensive'
* User can display spaghetti, if they really want!
Minor Bug Fix
* Small (display-related only) value fix
Nota Keluaran
Updated to cater for main charts that show trading hours outside the regular cash session (e.g. ES1!)If you're just displaying SPX, no need to change these sessions
If you're displaying extended hours, please change the settings:
a) 'Extended Hours'
b) Is it Summer Time (daylight savings) or Winter Time?
Outside of the cash session, the indicator is dormant (don't worry - it'll come to life at 09:30!)
Skrip sumber terbuka
Dalam semangat TradingView sebenar, pencipta skrip ini telah menjadikannya sumber terbuka, jadi pedagang boleh menilai dan mengesahkan kefungsiannya. Terima kasih kepada penulis! Walaupuan anda boleh menggunakan secara percuma, ingat bahawa penerbitan semula kod ini tertakluk kepada Peraturan Dalaman.
Penafian
Maklumat dan penerbitan adalah tidak bertujuan, dan tidak membentuk, nasihat atau cadangan kewangan, pelaburan, dagangan atau jenis lain yang diberikan atau disahkan oleh TradingView. Baca lebih dalam Terma Penggunaan.