OPEN-SOURCE SCRIPT
TREND barcolors
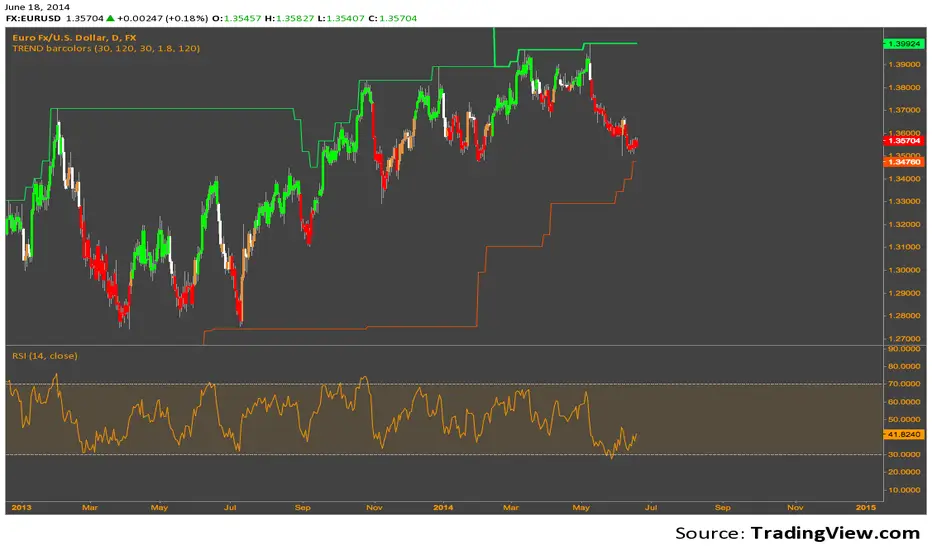
The Donchian values are basically from Ed Sekoytas original statistical run, that gave the values 30 & 120 (aren't as relevant today, but still packs a punch).
The idea of this code is just to take that 30, add a very simple inset of it, with ATR, and color code the bar Green or Red to indicate the direction of the trend. When a new break of the 120 line, (thick line) higher or lower, it typically indicates a bigger bias towards the trend.
It's my first publish, and so a very simple easy to understand system.
Use at your own risk. I cannot be held liable for any damages financial or otherwise, directly or indirectly related to using this script.
Skrip sumber terbuka
Dalam semangat sebenar TradingView, pencipta skrip ini telah menjadikannya sumber terbuka supaya pedagang dapat menilai dan mengesahkan kefungsiannya. Terima kasih kepada penulis! Walaupun anda boleh menggunakannya secara percuma, ingat bahawa menerbitkan semula kod ini adalah tertakluk kepada Peraturan Dalaman kami.
Penafian
Maklumat dan penerbitan adalah tidak dimaksudkan untuk menjadi, dan tidak membentuk, nasihat untuk kewangan, pelaburan, perdagangan dan jenis-jenis lain atau cadangan yang dibekalkan atau disahkan oleh TradingView. Baca dengan lebih lanjut di Terma Penggunaan.