OPEN-SOURCE SCRIPT
Triple HMA Bands (1.2 / 1.4 / 1.6)
📈 Triple HMA Bands — Custom Volatility & Trend Indicator
Description:
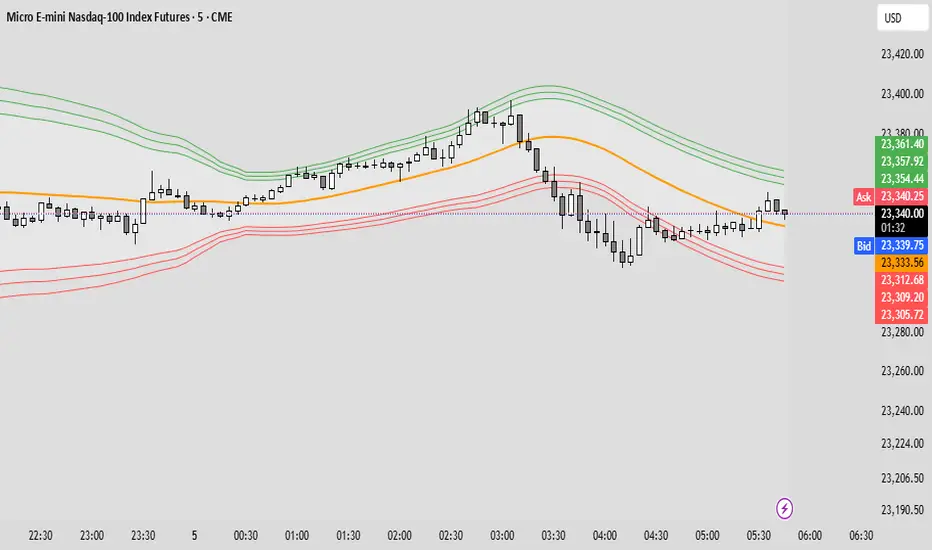
The Triple HMA Bands indicator combines the Hull Moving Average (HMA) with volatility-based envelopes, similar to Bollinger Bands, to visualize trend direction and market extremes.
The HMA (length 90) serves as the central trend line, offering a smooth and responsive view of market direction.
Surrounding the HMA are three dynamic bands calculated using standard deviations of price:
Inner Band (1.2σ) — normal volatility range.
Middle Band (1.4σ) — elevated volatility zone.
Outer Band (1.6σ) — statistically extreme price movement.
The shaded zones between the bands help visualize volatility expansion and contraction, making it easier to identify:
Trend strength and stability
Potential reversal zones
Breakout or breakdown events
How to Use:
Price staying within the inner band may indicate a stable trend or consolidation.
Price reaching or exceeding the outer band suggests overbought/oversold conditions and potential reversal.
Widening bands = rising volatility; narrowing bands = low volatility, often before a breakout.
This indicator is ideal for trend traders, mean reversion strategies, or anyone wanting a volatility-sensitive trend filter.
Description:
The Triple HMA Bands indicator combines the Hull Moving Average (HMA) with volatility-based envelopes, similar to Bollinger Bands, to visualize trend direction and market extremes.
The HMA (length 90) serves as the central trend line, offering a smooth and responsive view of market direction.
Surrounding the HMA are three dynamic bands calculated using standard deviations of price:
Inner Band (1.2σ) — normal volatility range.
Middle Band (1.4σ) — elevated volatility zone.
Outer Band (1.6σ) — statistically extreme price movement.
The shaded zones between the bands help visualize volatility expansion and contraction, making it easier to identify:
Trend strength and stability
Potential reversal zones
Breakout or breakdown events
How to Use:
Price staying within the inner band may indicate a stable trend or consolidation.
Price reaching or exceeding the outer band suggests overbought/oversold conditions and potential reversal.
Widening bands = rising volatility; narrowing bands = low volatility, often before a breakout.
This indicator is ideal for trend traders, mean reversion strategies, or anyone wanting a volatility-sensitive trend filter.
Skrip sumber terbuka
Dalam semangat TradingView sebenar, pencipta skrip ini telah menjadikannya sumber terbuka, jadi pedagang boleh menilai dan mengesahkan kefungsiannya. Terima kasih kepada penulis! Walaupuan anda boleh menggunakan secara percuma, ingat bahawa penerbitan semula kod ini tertakluk kepada Peraturan Dalaman.
Penafian
Maklumat dan penerbitan adalah tidak bertujuan, dan tidak membentuk, nasihat atau cadangan kewangan, pelaburan, dagangan atau jenis lain yang diberikan atau disahkan oleh TradingView. Baca lebih dalam Terma Penggunaan.