OPEN-SOURCE SCRIPT
RahulLines Cloud
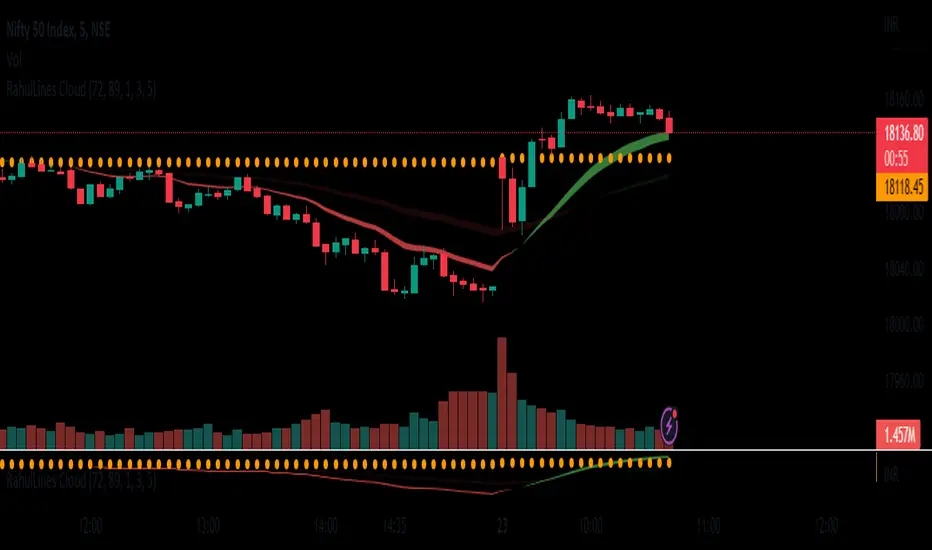
J-Lines Cloud is a technical analysis tool that is used to identify potential support and resistance levels on a chart. It is based on the concept of the "J-Lines," which are lines that are drawn on a chart in order to identify potential turning points in price. The J-Lines Cloud is a variation of the J-Lines that is used to identify levels of support and resistance using cloud, it typically uses multiple lines to create a cloud-like shape, which represents a zone of support or resistance.
To use the J-Lines Cloud, you will typically need a charting platform that has the ability to plot the J-Lines Cloud indicator. The indicator will typically take the form of a cloud-like shape on the chart, with different colors used to represent different levels of support and resistance.
Once the J-Lines Cloud is plotted on the chart, traders can use it to identify potential levels at which the price of an asset may change direction. For example, if the price of an asset is approaching a level of resistance identified by the J-Lines Cloud, a trader may choose to sell or exit a long position. Conversely, if the price of an asset is approaching a level of support identified by the J-Lines Cloud, a trader may choose to buy or enter a long position.
It's important to note that the J-Lines Cloud is a tool for technical analysis and not a standalone strategy, it should be used in combination with other indicators or strategies and also it should be used with the proper risk management and stop loss analysis.
Skrip sumber terbuka
Dalam semangat TradingView sebenar, pencipta skrip ini telah menjadikannya sumber terbuka, jadi pedagang boleh menilai dan mengesahkan kefungsiannya. Terima kasih kepada penulis! Walaupuan anda boleh menggunakan secara percuma, ingat bahawa penerbitan semula kod ini tertakluk kepada Peraturan Dalaman.
Penafian
Maklumat dan penerbitan adalah tidak bertujuan, dan tidak membentuk, nasihat atau cadangan kewangan, pelaburan, dagangan atau jenis lain yang diberikan atau disahkan oleh TradingView. Baca lebih dalam Terma Penggunaan.