PROTECTED SOURCE SCRIPT
Telah dikemas kini Squeeze Zone
This script supports my previous post Empirical Suite
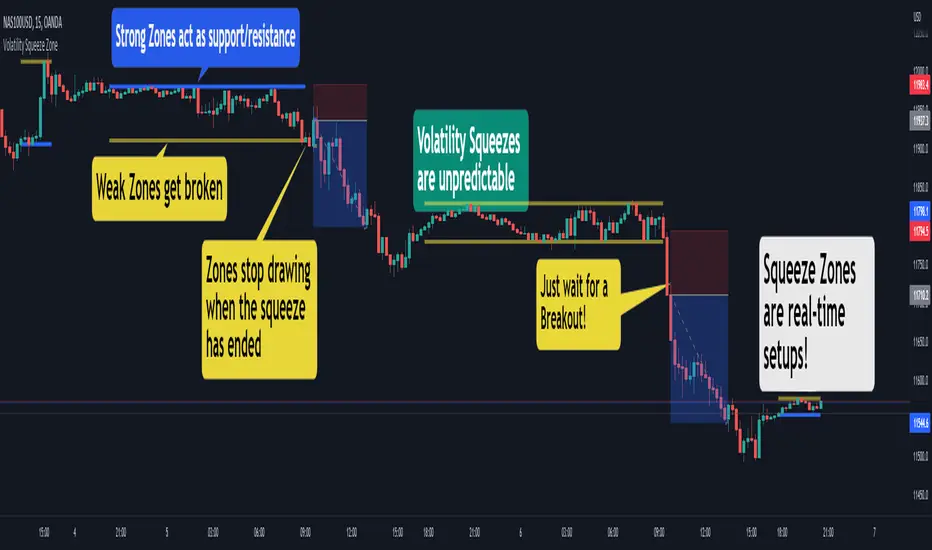
It automatically plots Support and Resistance levels on the chart during periods of volatility squeeze.
You have three plotting methods:
The levels are color-coded:
*Red: weak, one-sided volatility squeeze
*Orange: typically strong, no volatility issue
You can have a double-red zone, where both buying and selling volatility has dropped.
Combine this with the Empirical Suite or your favorite
analysis tools for extra confirmation.
Cheers,
EFX
It automatically plots Support and Resistance levels on the chart during periods of volatility squeeze.
You have three plotting methods:
- From High to Low
- From Open to Close
- Linear Regression (experimental)
The levels are color-coded:
*Red: weak, one-sided volatility squeeze
*Orange: typically strong, no volatility issue
You can have a double-red zone, where both buying and selling volatility has dropped.
Combine this with the Empirical Suite or your favorite
analysis tools for extra confirmation.
Cheers,
EFX
Nota Keluaran
Updated defaultsRemoved poorly performing settings
Nota Keluaran
- Upgrade to Pine V5
- Choose your own colors for Zones!
- Improved default settings
Skrip dilindungi
Skrip ini diterbitkan sebagai sumber tertutup. Akan tetapi, anda boleh menggunakannya secara bebas dan tanpa apa-apa had – ketahui lebih di sini.
Algo Trading Simplified 👉 PaxProfits.com
Discover the easy way to manage Forex trading accounts. Trusted by traders globally.
Discover the easy way to manage Forex trading accounts. Trusted by traders globally.
Penafian
Maklumat dan penerbitan adalah tidak bertujuan, dan tidak membentuk, nasihat atau cadangan kewangan, pelaburan, dagangan atau jenis lain yang diberikan atau disahkan oleh TradingView. Baca lebih dalam Terma Penggunaan.