OPEN-SOURCE SCRIPT
KT_Smooth_Stochastic
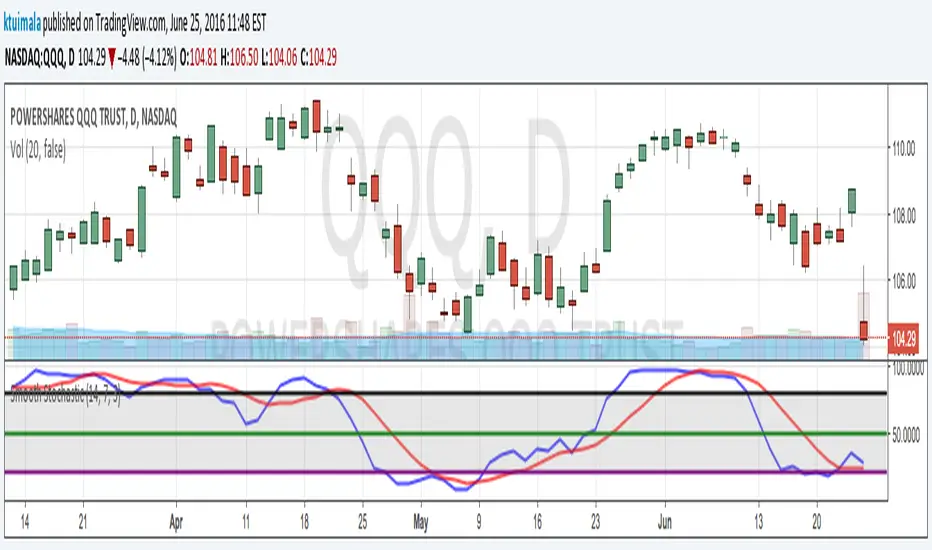
I normally don't publish my indicators. However, I couldn't find a smoothed stochastic on TradingView officially or unofficially. This is a standard implementation of a smoothed Fast Stochastic where %K and %D are calculated and then smoothed by n periods. This helps to reduce chop and gives better extreme signals.
I have defaulted the indicator to use commonly used settings where %K is over 14 periods, %D is over 7 period, and the smoothing factor is 3 periods. I have also defaulted the extreme lines to an upper band of 80, mid band of 50, and lower band of 20. However, my favorite settings are %K = 10, %D = 10, Smooth = 3, upper band = 75, mid band = 50, and lower band = 25.
I have defaulted the indicator to use commonly used settings where %K is over 14 periods, %D is over 7 period, and the smoothing factor is 3 periods. I have also defaulted the extreme lines to an upper band of 80, mid band of 50, and lower band of 20. However, my favorite settings are %K = 10, %D = 10, Smooth = 3, upper band = 75, mid band = 50, and lower band = 25.
Skrip sumber terbuka
Dalam semangat sebenar TradingView, pencipta skrip ini telah menjadikannya sumber terbuka supaya pedagang dapat menilai dan mengesahkan kefungsiannya. Terima kasih kepada penulis! Walaupun anda boleh menggunakannya secara percuma, ingat bahawa menerbitkan semula kod ini adalah tertakluk kepada Peraturan Dalaman kami.
Penafian
Maklumat dan penerbitan adalah tidak dimaksudkan untuk menjadi, dan tidak membentuk, nasihat untuk kewangan, pelaburan, perdagangan dan jenis-jenis lain atau cadangan yang dibekalkan atau disahkan oleh TradingView. Baca dengan lebih lanjut di Terma Penggunaan.