OPEN-SOURCE SCRIPT
Percent Change Indicator
Percent Change Indicator Description
Overview:
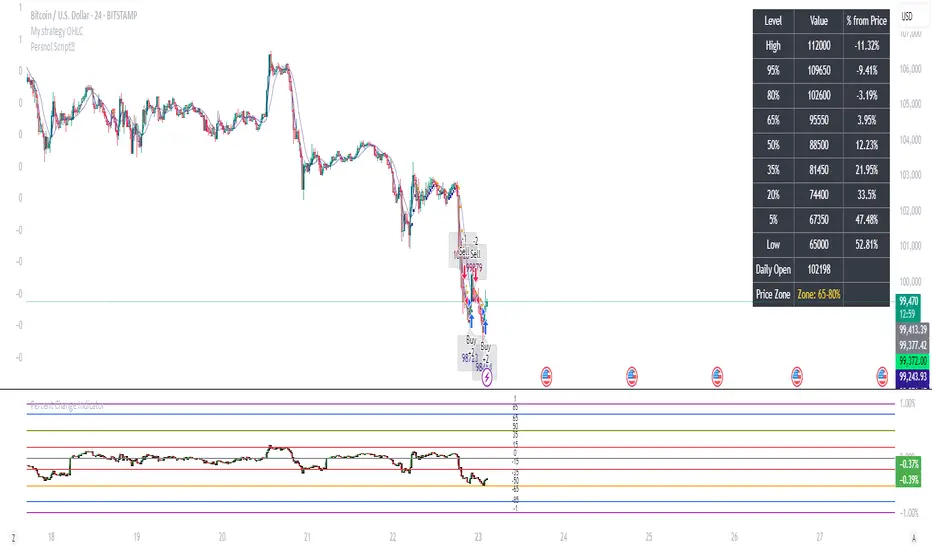
The Percent Change Indicator is a Pine Script (version 6) indicator designed for TradingView to calculate and visualize the percentage change of the current close price relative to a user-selected reference price. It provides a customizable interface to display percentage changes as candlesticks or a line plot, with optional horizontal lines and labels for key levels. The indicator also includes visual signals and alerts for user-defined percentage thresholds, making it useful for identifying significant price movements.
Key Features:
1. Percentage Change Calculation:
- Computes the percentage change of the current close price compared to a reference price, scaled by a user-defined length parameter.
- Formula: percentChange = (close - refPrice) / refPrice * len
- The reference price is sourced from a user-selected timeframe (default: 1D) and price type (Open, High, Low, Close, HL2, HLC3, or HLCC4).
2. Visualization Options:
- Candlestick Plot: Displays percentage change as candlesticks, colored green for rising values and red for falling values.
- Line Plot: Plots the percentage change as a line, with the same color logic.
- Horizontal Lines: Optional horizontal lines at key percentage levels (0%, ±0.2%, ±0.5%, ±0.8%, ±1%) for reference.
- Labels: Optional labels for percentage levels (0, ±15%, ±35%, ±50%, ±65%, ±85%, ±100%) displayed at the chart's right edge.
- All visualizations are toggleable via input settings.
3. Signal and Alert System:
- Threshold-Based Signals: Plots green triangles below bars for long signals (percent change above a user-defined threshold) and red triangles above bars for short signals (percent change below the threshold).
- Alerts: Configurable alerts for long and short conditions, triggered when the percentage change crosses the user-defined threshold (default: 2%). Alert messages include the threshold value for clarity.
4. Customizable Inputs:
- Show Labels: Toggle visibility of percentage level labels (default: true).
- Show Percentage Change: Toggle the line plot of percentage change (default: true).
- Show HLines: Toggle visibility of horizontal reference lines (default: false).
- Show Candle Plot: Toggle the candlestick plot (default: true).
- Percent Change Length: Adjust the scaling factor for percentage change (default: 14).
- Plot Timeframe: Select the timeframe for the reference price (default: 1D).
- Price Type: Choose the reference price type (Open, High, Low, Close, HL2, HLC3, HLCC4; default: Open).
- Percentage Threshold: Set the threshold for long/short signals and alerts (default: 0.02 or 2%).
How It Works:
- The indicator fetches the reference price using request.security() based on the selected timeframe and price type.
- It calculates the percentage change and scales it by the user-defined length.
- Visuals (candlesticks, lines, labels, horizontal lines) are plotted based on user preferences.
- Long and short signals are generated when the percentage change exceeds or falls below the user-defined threshold, with corresponding triangles plotted and alerts triggered.
Use Cases:
- Trend Identification: Monitor significant price movements relative to a reference price.
- Signal Generation: Identify potential entry/exit points based on percentage change thresholds.
- Custom Analysis: Analyze price changes across different timeframes and price types for various trading strategies.
- Alert Notifications: Receive alerts for significant price movements to stay informed without constant chart monitoring.
Setup Instructions:
1. Add the indicator to a TradingView chart.
2. Adjust input settings (timeframe, price type, threshold, etc.) to suit your analysis.
3. Enable/disable visualization options (candlesticks, lines, labels, horizontal lines) as needed.
4. Set up alerts in TradingView:
- Go to the "Alerts" tab and select "Percent Change Indicator."
- Choose "Long Alert" or "Short Alert" to monitor threshold crossings.
- Configure alert frequency and notification method (e.g., email, webhook).
Notes:
- The indicator is non-overlay, displayed in a separate pane below the main chart.
- Alerts trigger on bar close by default; adjust TradingView alert settings for real-time notifications if needed.
- The indicator is released under the Mozilla Public License 2.0.
Author: Dshergill
This indicator is ideal for traders seeking a flexible tool to track percentage-based price movements with customizable visuals and alerts.
Overview:
The Percent Change Indicator is a Pine Script (version 6) indicator designed for TradingView to calculate and visualize the percentage change of the current close price relative to a user-selected reference price. It provides a customizable interface to display percentage changes as candlesticks or a line plot, with optional horizontal lines and labels for key levels. The indicator also includes visual signals and alerts for user-defined percentage thresholds, making it useful for identifying significant price movements.
Key Features:
1. Percentage Change Calculation:
- Computes the percentage change of the current close price compared to a reference price, scaled by a user-defined length parameter.
- Formula: percentChange = (close - refPrice) / refPrice * len
- The reference price is sourced from a user-selected timeframe (default: 1D) and price type (Open, High, Low, Close, HL2, HLC3, or HLCC4).
2. Visualization Options:
- Candlestick Plot: Displays percentage change as candlesticks, colored green for rising values and red for falling values.
- Line Plot: Plots the percentage change as a line, with the same color logic.
- Horizontal Lines: Optional horizontal lines at key percentage levels (0%, ±0.2%, ±0.5%, ±0.8%, ±1%) for reference.
- Labels: Optional labels for percentage levels (0, ±15%, ±35%, ±50%, ±65%, ±85%, ±100%) displayed at the chart's right edge.
- All visualizations are toggleable via input settings.
3. Signal and Alert System:
- Threshold-Based Signals: Plots green triangles below bars for long signals (percent change above a user-defined threshold) and red triangles above bars for short signals (percent change below the threshold).
- Alerts: Configurable alerts for long and short conditions, triggered when the percentage change crosses the user-defined threshold (default: 2%). Alert messages include the threshold value for clarity.
4. Customizable Inputs:
- Show Labels: Toggle visibility of percentage level labels (default: true).
- Show Percentage Change: Toggle the line plot of percentage change (default: true).
- Show HLines: Toggle visibility of horizontal reference lines (default: false).
- Show Candle Plot: Toggle the candlestick plot (default: true).
- Percent Change Length: Adjust the scaling factor for percentage change (default: 14).
- Plot Timeframe: Select the timeframe for the reference price (default: 1D).
- Price Type: Choose the reference price type (Open, High, Low, Close, HL2, HLC3, HLCC4; default: Open).
- Percentage Threshold: Set the threshold for long/short signals and alerts (default: 0.02 or 2%).
How It Works:
- The indicator fetches the reference price using request.security() based on the selected timeframe and price type.
- It calculates the percentage change and scales it by the user-defined length.
- Visuals (candlesticks, lines, labels, horizontal lines) are plotted based on user preferences.
- Long and short signals are generated when the percentage change exceeds or falls below the user-defined threshold, with corresponding triangles plotted and alerts triggered.
Use Cases:
- Trend Identification: Monitor significant price movements relative to a reference price.
- Signal Generation: Identify potential entry/exit points based on percentage change thresholds.
- Custom Analysis: Analyze price changes across different timeframes and price types for various trading strategies.
- Alert Notifications: Receive alerts for significant price movements to stay informed without constant chart monitoring.
Setup Instructions:
1. Add the indicator to a TradingView chart.
2. Adjust input settings (timeframe, price type, threshold, etc.) to suit your analysis.
3. Enable/disable visualization options (candlesticks, lines, labels, horizontal lines) as needed.
4. Set up alerts in TradingView:
- Go to the "Alerts" tab and select "Percent Change Indicator."
- Choose "Long Alert" or "Short Alert" to monitor threshold crossings.
- Configure alert frequency and notification method (e.g., email, webhook).
Notes:
- The indicator is non-overlay, displayed in a separate pane below the main chart.
- Alerts trigger on bar close by default; adjust TradingView alert settings for real-time notifications if needed.
- The indicator is released under the Mozilla Public License 2.0.
Author: Dshergill
This indicator is ideal for traders seeking a flexible tool to track percentage-based price movements with customizable visuals and alerts.
Skrip sumber terbuka
Dalam semangat TradingView sebenar, pencipta skrip ini telah menjadikannya sumber terbuka, jadi pedagang boleh menilai dan mengesahkan kefungsiannya. Terima kasih kepada penulis! Walaupuan anda boleh menggunakan secara percuma, ingat bahawa penerbitan semula kod ini tertakluk kepada Peraturan Dalaman.
Penafian
Maklumat dan penerbitan adalah tidak bertujuan, dan tidak membentuk, nasihat atau cadangan kewangan, pelaburan, dagangan atau jenis lain yang diberikan atau disahkan oleh TradingView. Baca lebih dalam Terma Penggunaan.