OPEN-SOURCE SCRIPT
Telah dikemas kini [blackcat] L1 RSMK
Level 1
Background
This is a modified version of indicator from Markos Katsanos’ article in the March issue, “Using Relative Strength To Outperform The Market”.
Function
In “Using Relative Strength To Outperform The Market” in this issue, author Markos Katsanos presents a trading system based on a new relative strength indicator he calls RSMK. The indicator improves on the traditional relative strength indicator by separating periods of strong or weak relative strength.
I found it helpful for divergence identification.
Remarks
This is a Level 1 free and open source indicator.
Feedbacks are appreciated.
Nota Keluaran
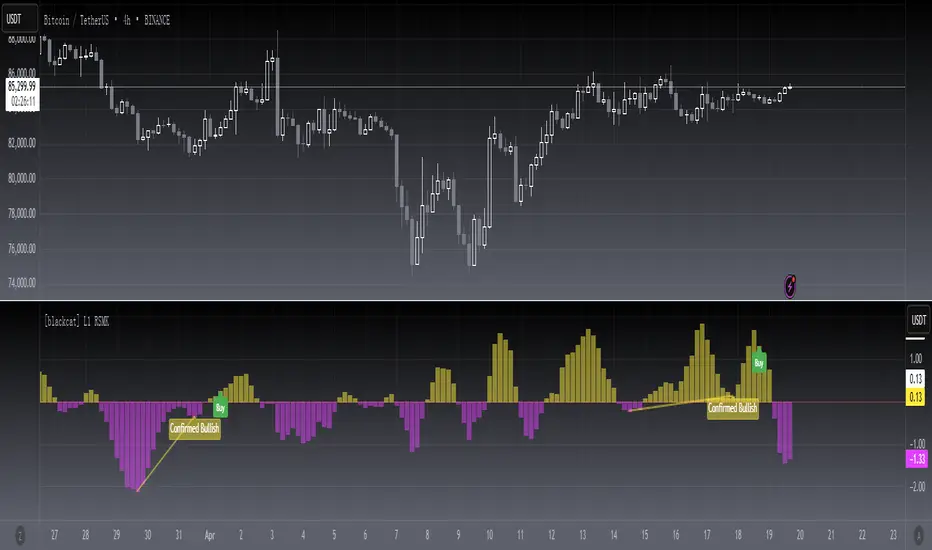
OVERVIEWThe [blackcat] L1 RSMK indicator is designed to help traders identify potential buy and sell opportunities using the Relative Strength Momentum Katsanos (RSMK). This script calculates the RSMK value based on stock prices and plots it on the chart with dynamic coloring. Additionally, it identifies divergences between price action and the RSMK, providing visual labels and alerts for potential trading signals 📈💡.
FEATURES
Calculates the Relative Strength Momentum Katsanos (RSMK) value.
Plots the RSMK line on the chart with dynamic coloring:
Yellow when above zero.
Fuchsia when below zero.
Identifies and plots various types of divergences:
Regular Bullish
Hidden Bullish
Regular Bearish
Hidden Bearish
Adds visual labels for easy identification of trade signals:
"Buy" labeled in green during confirmed bullish conditions.
"Sell" labeled in red during confirmed bearish conditions.
Provides alert conditions for all identified divergence patterns 🔔
HOW TO USE
Add the indicator to your TradingView chart by selecting it from the indicators list.
Monitor the plotted RSMK line for changes in momentum.
Observe the divergence patterns and corresponding labels on the chart for potential trade opportunities.
Set up alerts based on the generated signals to receive notifications when conditions are met 📲.
Use the indicator alongside other tools for confirmation before executing trades.
INPUT PARAMETERS
Length: Define the lookback period for calculating the RSMK (default is 55).
EMA Length: Specify the length for the Exponential Moving Average applied to the log values (default is 13).
Pivot Lookback Right/Lef: Adjust the range for identifying pivots (defaults are 5).
Max/MIn Lookback Range: Set the maximum and minimum ranges for looking back at data points (defaults are 60 and 5 respectively).
Plot Options:
Enable/disable plotting of different divergence types (regular/bullish/hidden).
LIMITATIONS
The indicator may generate false signals in choppy or ranging markets 🌪️.
Users should always confirm signals with other forms of analysis.
The responsiveness of the RSMK depends on the chosen parameters.
NOTES
Ensure that you have sufficient historical data available for accurate calculations.
Test the indicator thoroughly on demo accounts before applying it to live trading 🔍.
Customize input parameters to suit different market conditions and timeframes.
Skrip sumber terbuka
Dalam semangat TradingView sebenar, pencipta skrip ini telah menjadikannya sumber terbuka, jadi pedagang boleh menilai dan mengesahkan kefungsiannya. Terima kasih kepada penulis! Walaupuan anda boleh menggunakan secara percuma, ingat bahawa penerbitan semula kod ini tertakluk kepada Peraturan Dalaman.
Avoid losing contact!Don't miss out! The first and most important thing to do is to join my Discord chat now! Click here to start your adventure: discord.com/invite/ZTGpQJq 防止失联,请立即行动,加入本猫聊天群: discord.com/invite/ZTGpQJq
Penafian
Maklumat dan penerbitan adalah tidak bertujuan, dan tidak membentuk, nasihat atau cadangan kewangan, pelaburan, dagangan atau jenis lain yang diberikan atau disahkan oleh TradingView. Baca lebih dalam Terma Penggunaan.