OPEN-SOURCE SCRIPT
[RS]3 Level ZigZag Semafor V0
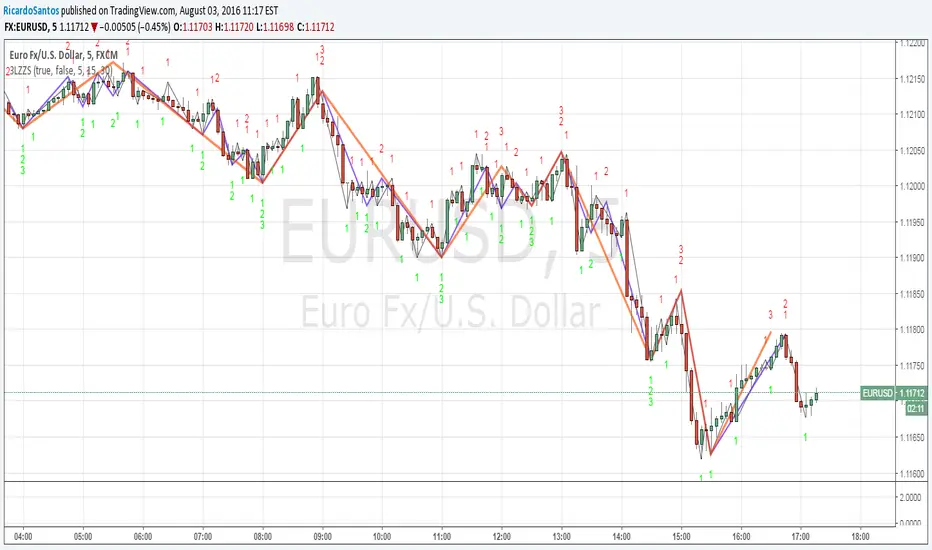
EXPERIMENTAL:
request for CharanTejaM
zigzag may be adjusted to use other methods.
zigzag repaints, use at your own discretion.
request for CharanTejaM
zigzag may be adjusted to use other methods.
zigzag repaints, use at your own discretion.
Skrip sumber terbuka
Dalam semangat sebenar TradingView, pencipta skrip ini telah menjadikannya sumber terbuka supaya pedagang dapat menilai dan mengesahkan kefungsiannya. Terima kasih kepada penulis! Walaupun anda boleh menggunakannya secara percuma, ingat bahawa menerbitkan semula kod ini adalah tertakluk kepada Peraturan Dalaman kami.
Penafian
Maklumat dan penerbitan adalah tidak dimaksudkan untuk menjadi, dan tidak membentuk, nasihat untuk kewangan, pelaburan, perdagangan dan jenis-jenis lain atau cadangan yang dibekalkan atau disahkan oleh TradingView. Baca dengan lebih lanjut di Terma Penggunaan.