OPEN-SOURCE SCRIPT
Swing S/R Bounce Screener
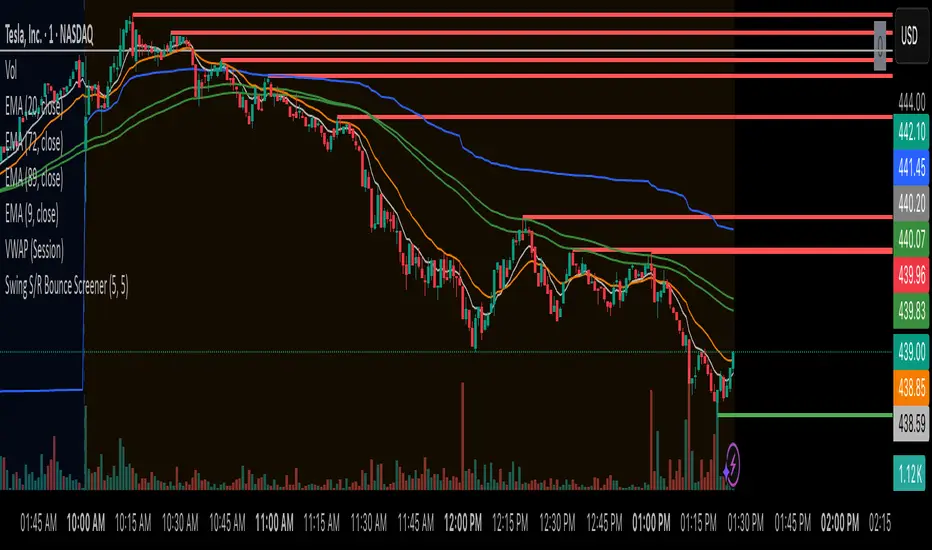
Step 1: Identify Swing Highs & Lows on 1 minute timeframe
- price bars that stand out from the 5 bars on each side (left and right). A swing high is a bar whose high is higher than the 5 bars before and after it. A swing low is a bar whose low is lower than the 5 bars before and after it.
Step 2: Draw Horizontal Lines
When a swing high/low is identified, the scanner draws a horizontal line from that point extending to the right of the chart.
Step 3: Monitor Price Returns
The scanner continuously watches for price to return to these horizontal lines. When price approaches and touches the line:
* Resistance: Price touches from below and closes below the line
* Support: Price touches from above and closes above the line
Skrip sumber terbuka
Dalam semangat sebenar TradingView, pencipta skrip ini telah menjadikannya sumber terbuka supaya pedagang dapat menilai dan mengesahkan kefungsiannya. Terima kasih kepada penulis! Walaupun anda boleh menggunakannya secara percuma, ingat bahawa menerbitkan semula kod ini adalah tertakluk kepada Peraturan Dalaman kami.
Penafian
Maklumat dan penerbitan adalah tidak dimaksudkan untuk menjadi, dan tidak membentuk, nasihat untuk kewangan, pelaburan, perdagangan dan jenis-jenis lain atau cadangan yang dibekalkan atau disahkan oleh TradingView. Baca dengan lebih lanjut di Terma Penggunaan.