PROTECTED SOURCE SCRIPT
Telah dikemas kini Trend Strength Indicator
How to use?
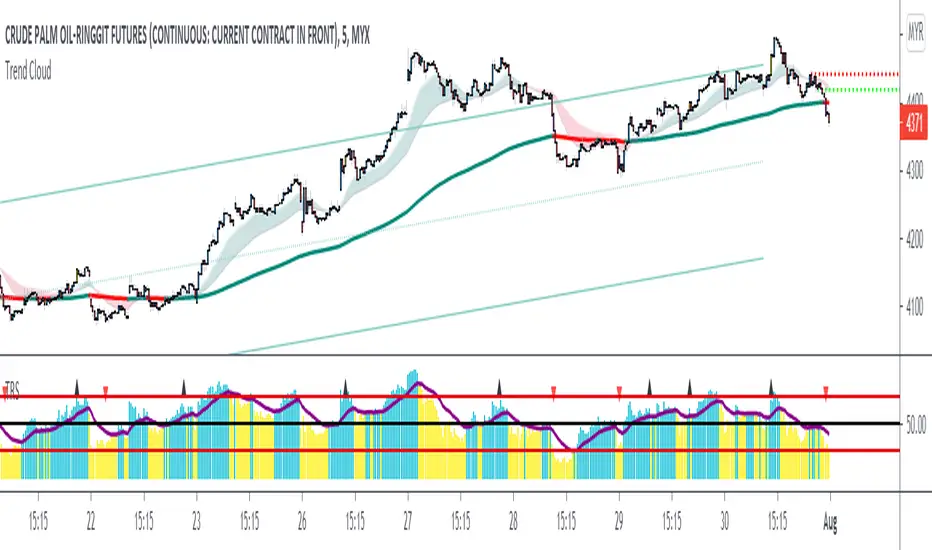
1) The purple line summarizes the overall trend strength.
If the purple line is above 50, the market is considered to be bullish
If the purple line is below 50, the market is then considered to be bearish
Buy-Long position can be considered when the purple line is crossing up the 50-line and exit-long position can be considered vice versa.
However it is best to let the purple line to test the 50 line after crossing.
2) Each bar represents the each price movement strength index.
If the bar is above the purple line, the bar's color will become blue, indicating that the price is gaining momentum.
If the bar is below the purple line, the bar's color will turn to yellow, indicating the prices is losing momentum.
Default setting is period : 20, average : 20. It can be customized based on trading style and risk tolerance.
Nota Keluaran
Changed default setting from 20/20 to 14/14Change lower base from 20 to 0
Nota Keluaran
Adjusted the precision for divergence Nota Keluaran
1) Updated calculation coding and default setting (14/14 to 14/20) to reduce noise2) Add up color bar coding. When Average line crosses up 50 line, bar color will turn to yellow and turns to purple when crosses down 50-line
Nota Keluaran
1) Updated name from Trend Strength Indicator to Trend Relative Strength2) Introduced input for average up & average down control
Skrip dilindungi
Skrip ini diterbitkan sebagai sumber tertutup. Akan tetapi, anda boleh menggunakannya secara bebas dan tanpa apa-apa had – ketahui lebih di sini.
Penafian
Maklumat dan penerbitan adalah tidak bertujuan, dan tidak membentuk, nasihat atau cadangan kewangan, pelaburan, dagangan atau jenis lain yang diberikan atau disahkan oleh TradingView. Baca lebih dalam Terma Penggunaan.