OPEN-SOURCE SCRIPT
Telah dikemas kini MARS - Moving Average Relative Strength
The original idea from this script is from the script "Percentage Relative Strength" by dman103. The original script compared a symbol to an index by their everyday percentage change. The symbol percentage was subtracted from percentage change of the index, & the results were then smoothed by moving averages.
Instead of daily percentage changes, this script directly calculates relative strength via a moving average. We call this simpler approach as MARS (Moving Average Relative Strength).
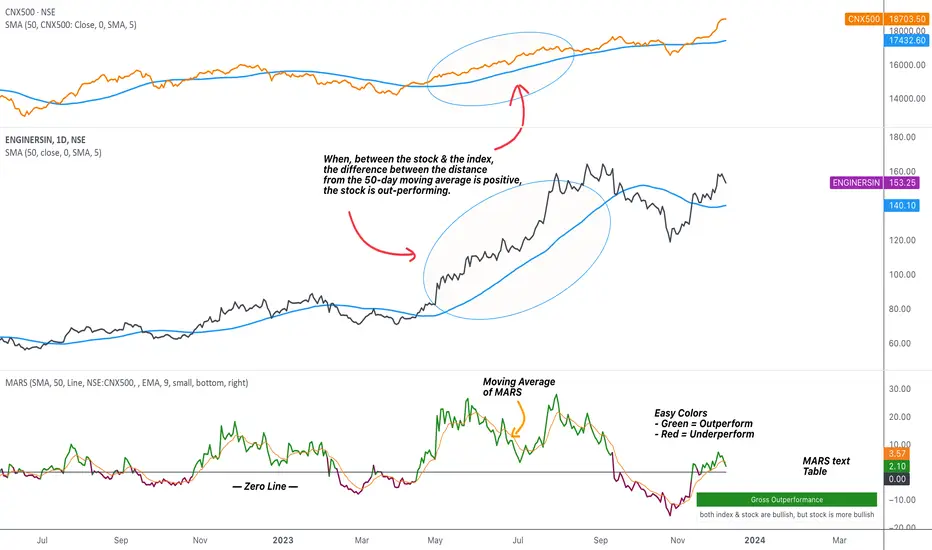
MARS compares a symbol to the index by making use of the price's distance from a moving average. By default, we compare the distance from the 50-day simple moving average of the stock vs that of the index. Both the type & the length of the moving average is customisable.
Background color indicates the index being above or below its moving average.
The histogram indicates whether the stock is under-performing or out-performing the index.
The color of the histogram indicates the type of out-performance or under-performance. There can be a total of 6 such colors:
Additional customisation options:
Instead of daily percentage changes, this script directly calculates relative strength via a moving average. We call this simpler approach as MARS (Moving Average Relative Strength).
MARS compares a symbol to the index by making use of the price's distance from a moving average. By default, we compare the distance from the 50-day simple moving average of the stock vs that of the index. Both the type & the length of the moving average is customisable.
Background color indicates the index being above or below its moving average.
- Blue background: index is above its moving average
- Pink background: index is below its moving average
The histogram indicates whether the stock is under-performing or out-performing the index.
- Up-bars: stock is out-performing the index i.e. between the stock & the index, the difference between the distance to/from the 50-day moving average is a positive value.
- Down-bars: stock is under-performing the index i.e. between the stock & the index, the difference between the distance to/from the 50-day moving average is a negative value.
The color of the histogram indicates the type of out-performance or under-performance. There can be a total of 6 such colors:
- Relative out-performance: both index & stock are bearish, but stock is less bearish. The script prints light green up-bars on a pink background.
- Gross out-performance: both index & stock are bullish, but stock is more bullish. The script prints green up-bars on a blue background.
- Absolute out-performance: index is bearish, but stock is bullish! The script prints blue up-bars on a pink background.
- Relative under-performance: both index & stock are bullish, but stock is less bullish. The script prints light red bars on a blue background.
- Gross under-performance: both index & stock are bearish, but stock is more bearish. The script prints dark red bars on a pink background.
- Absolute under-performance: index is bullish, but stock is bearish! The script prints black down-bars on a blue background.
Additional customisation options:
- Paint bars option changes the bar colors to mirror the histogram colors.
- Easy colors option just changes the histogram colors to either blue or pink, indicating out-performance or under-performance, respectively. This is when the trader does not wish to demarcate between the above-mentioned 6 conditions.
Nota Keluaran
Minor bug fixes in the code.Nota Keluaran
Added an option to change the colour of the Zero line.Nota Keluaran
⦿ Default plot display is now a line style, instead of the previous histogram style. This is still user-customisable.⦿ Moving average for smoothing of MARS is now incorporated. By default, it uses a 9 EMA of MARS. If the MARS stays above its moving average, it indicates that MARS is going up, & is a bullish sign.
⦿ Text description of the current relative strength state is visible as a table. It is a verbose table by default (with details of the current MARS state). You can turn off the detailed text or even turn off the entire table altogether.
⦿ Easy color mode is modified & turned on by default. Easy colors are now really 'easy', as the strong & weak colors are now represented by green & red, respectively.
Nota Keluaran
Updated to include more options in the 'Index to compare to' dropdown. Default now is NIFTYMIDSML400.Skrip sumber terbuka
Dalam semangat TradingView sebenar, pencipta skrip ini telah menjadikannya sumber terbuka, jadi pedagang boleh menilai dan mengesahkan kefungsiannya. Terima kasih kepada penulis! Walaupuan anda boleh menggunakan secara percuma, ingat bahawa penerbitan semula kod ini tertakluk kepada Peraturan Dalaman.
Penafian
Maklumat dan penerbitan adalah tidak bertujuan, dan tidak membentuk, nasihat atau cadangan kewangan, pelaburan, dagangan atau jenis lain yang diberikan atau disahkan oleh TradingView. Baca lebih dalam Terma Penggunaan.
Skrip sumber terbuka
Dalam semangat TradingView sebenar, pencipta skrip ini telah menjadikannya sumber terbuka, jadi pedagang boleh menilai dan mengesahkan kefungsiannya. Terima kasih kepada penulis! Walaupuan anda boleh menggunakan secara percuma, ingat bahawa penerbitan semula kod ini tertakluk kepada Peraturan Dalaman.
Penafian
Maklumat dan penerbitan adalah tidak bertujuan, dan tidak membentuk, nasihat atau cadangan kewangan, pelaburan, dagangan atau jenis lain yang diberikan atau disahkan oleh TradingView. Baca lebih dalam Terma Penggunaan.