OPEN-SOURCE SCRIPT
Bollinger Bands (SMA) with Trend Filtered Buy/Sell
Overview
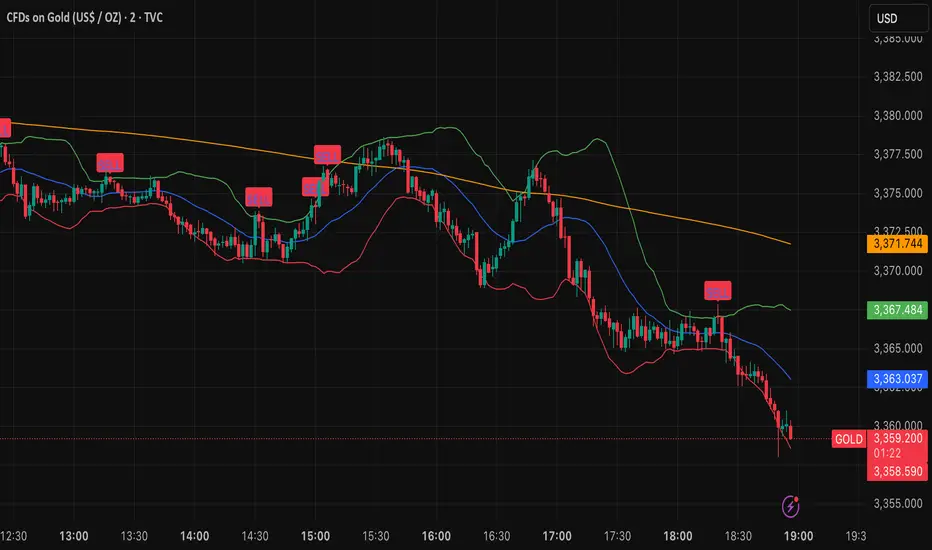
This indicator is a trend-following Bollinger Bands tool based on SMA, enhanced with a 200 SMA filter to display BUY/SELL signals only in the direction of the prevailing trend.
Instead of showing every possible reversal, it focuses on high-probability entries aligned with the trend.
Key Features
Feature Description
Bollinger Bands (SMA) Plots upper, lower, and middle bands using Simple Moving Average (SMA) and standard deviation.
200 SMA Trend Filter Determines the overall market trend (bullish or bearish).
BUY/SELL Signals Generates signals when price reacts from Bollinger Bands.
Trend Filtering Only BUY signals above the 200 SMA, only SELL signals below the 200 SMA.
Alert Function TradingView alerts can be triggered when a signal occurs.
Toggle ON/OFF Option to enable or disable signal display.
Signal Logic
BUY Signal
Price is above the 200 SMA (uptrend)
Previous candle closed below the lower Bollinger Band
Current candle closes back inside the band → Confirmed rebound → BUY signal
SELL Signal
Price is below the 200 SMA (downtrend)
Previous candle closed above the upper Bollinger Band
Current candle closes back inside the band → Confirmed pullback → SELL signal
How to Use
Trend-Following Entries:
Enter trades only in the trend direction, improving accuracy and reducing countertrend trades.
Filter Out False Signals:
The 200 SMA filter removes noise from opposite-trend signals.
Alerts:
Receive notifications when a valid BUY/SELL setup appears without watching the chart constantly.
This indicator is ideal for traders who want to focus on high-probability trend-following setups, especially in markets like Forex or Gold, where strong one-way moves often occur.
このインジケーターは、SMAベースのボリンジャーバンドにトレンドフィルター(200SMA)を追加し、トレンドフォロー型のBUY/SELLシグナルを表示するツールです。
短期の逆張りではなく、大きなトレンド方向に沿ったシグナルだけを出すように設計されています。
主な機能
機能 説明
ボリンジャーバンド (SMA) 期間を指定した単純移動平均(SMA)を基準に、標準偏差で上下のバンドを表示
200SMA(トレンド判定) 現在の相場が上昇トレンドか下降トレンドかを判断
BUY/SELLシグナル ボリンジャーバンドの反発を検出してシグナル表示
トレンドフィルター 200SMAより上ならBUYのみ、200SMAより下ならSELLのみ表示
アラート機能 BUY/SELLシグナル発生時にTradingViewのアラートで通知可能
ON/OFF切替 BUY/SELLシグナルの表示はスイッチでON/OFF可能
シグナルロジック
BUYシグナル
200SMAより上にいる
前の足で価格がボリンジャーバンド下限を下抜け
現在の足でバンド内に戻る → 反発確認 → BUYシグナル表示
SELLシグナル
200SMAより下にいる
前の足で価格がボリンジャーバンド上限を上抜け
現在の足でバンド内に戻る → 反落確認 → SELLシグナル表示
トレードでの使い方
トレンドフォロー型エントリー
→ 200SMAを基準に、相場の方向に沿ったエントリーだけを狙う
逆張りのフィルタリング
→ トレンドに逆らう無駄なシグナルを表示しない
アラート通知
→ チャートを見ていなくても、シグナル発生時に通知可能
このインジケーターは「トレンドフォローの精度を高めたいトレーダー」向けです。
特にゴールドやFXで、一方向の強いトレンドが出やすい相場で有効です。
Skrip sumber terbuka
Dalam semangat sebenar TradingView, pencipta skrip ini telah menjadikannya sumber terbuka supaya pedagang dapat menilai dan mengesahkan kefungsiannya. Terima kasih kepada penulis! Walaupun anda boleh menggunakannya secara percuma, ingat bahawa menerbitkan semula kod ini adalah tertakluk kepada Peraturan Dalaman kami.
Penafian
Maklumat dan penerbitan adalah tidak dimaksudkan untuk menjadi, dan tidak membentuk, nasihat untuk kewangan, pelaburan, perdagangan dan jenis-jenis lain atau cadangan yang dibekalkan atau disahkan oleh TradingView. Baca dengan lebih lanjut di Terma Penggunaan.